Year 2009


April bluebells in a Devon woodland.
Summary for 2009

A cold, dry start to the year but things soon warmed up and this led into a gloriously warm and sunny Spring. The warmth lasted until the beginning of July then the first really unsettled spell of the year started with virtually the whole of the month being cool, windy and wet making it the wettest July on record with 350% of the average rainfall. Drier, slightly warmer weather returned in August but it remained stubbornly sunless. It took until September for 'real' summer weather to return since the sunny and warm June of 3 months earlier. October and November continued the warmth, though rather more unsettled, especially November which turned out to be a remarkably wet and windy month. The first cold weather since early February arrived in December.

Warmer than 2008, but slightly cooler than 2006 & 2007. Drier but rather less sunshine than either 2007 & 2008.

     
Summary 2009
Mean Max 15.0ºC  
Mean Min 7.2ºC  
Mean 11.1ºC  
     
High Max 28.5ºC 3rd Jun
Low Max 1.1ºC 7th Jan
High Min 17.2ºC 2nd Jul
Low Min -8.4ºC 7th Jan
Mean Grass Min: 4.4ºC  
Grass Min: -10.3ºC 19th Dec
   
Rain Total (gauge) 887.7 mm  
Rain Total (tipping bucket) 796.6 mm  
Rain Days >0.2 169 Days  
Rain Days >1.0 138 Days  
Max 24 hrs 27.0 mm 6th Jun
   
Air Frost 32 Days  
Ground Frost: 76 Days  
Snow Falling 4 Days  
Snow (50%) @ 9am 2 Days  
Thunder Heard 11 Days  
Hail <5 mm 4 Days  
Hail >5 mm 0 Days  
Fog @ 9am 4 Days  
   
Total Monthly Sunshine: 1703 Hours  
Most Sunshine in a Day: 15.7 Hours 30th May
Average Daily Sunshine: 4.7 Hours  
Sunless Days: 31 Days  
Cloudless Days: 32 Days  
Total Possible Sunshine: 4547h:49m  
Percentage of Total Sun: 37%  
   
Mean Soil Temp @ 30 cm: 10.6ºC  
Min Soil Temp @ 30 cm: 0.8ºC 8th Jan
Max Soil Temp @ 30 cm: 19.2ºC 2nd Jul
Mean Soil Temp @ 100 cm: 10.5ºC  
Min Soil Temp @ 100 cm: 4.0ºC 12th Jan
Max Soil Temp @ 100 cm: 15.8ºC 29th Aug
   
Wind >39 mph 6.0 Days  
N 30.8 Days  
NE 32.7 Days  
E 27.5 Days  
SE 66.9 Days  
S 44.3 Days  
SW 41.4 Days  
W 65.1 Days  
NW 20.3 Days  
Calm 24.0 Days  
Mean Wind 3.9 mph  
Max Gust 48 mph 8th Mar
   
Mean Cloud Cover: 53%  
Mean RH @ 9am: 89%  
Rain Duration >0.1mm/hour: 487.0 Hours  
Frost Duration: 310.3 Hours  
Max Frost Duration in a Day: 19.3 Hours 2nd Feb
   
Mean Sea Temperature: 12.7ºC  
Normal for Month:    
Max Sea Temperature: 20.3ºC 7th Aug
Min Sea Temperature: 6.4ºC 11th Jan
   
Mean Pressure 1013 hPa  
Max Pressure 1037 hPa 11th Sep
Min Pressure 970 hPa 23rd Jan
   
Max Dewpoint: 18.4ºC  
Min Dewpoint: -11.2ºC  
Mean Dewpoint: 6.6ºC  
     
Max Humidity: 100%  
Min Humidity: 35%  
Mean Humidity: 78%  


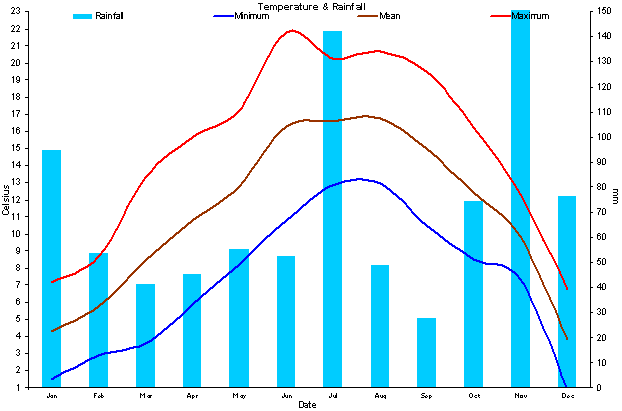
2009 was warmer than the long-term average. The Met Office ranked the year as the 10th warmest ever recorded.
Overall it was slightly wetter than the average, though the first 6 months were drier than normal, the second half was wet (except for September) with July and November being exceptionally wet.
There was a high number of ground frosts and this was due to lot of nights with calm, clear and starry conditions. This also led to a higher than average number frosts.
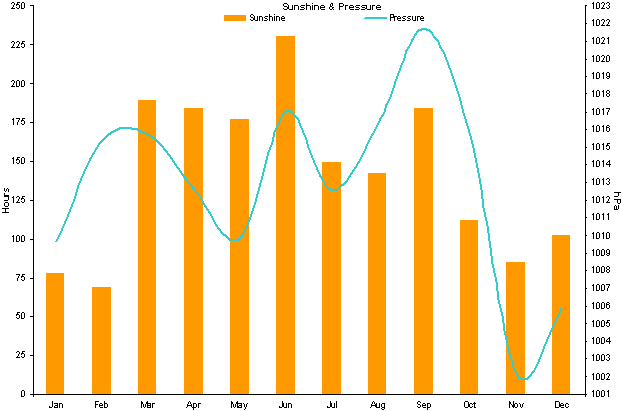
Sunshine levels were below the long-term average, and levels in July and August were particularly disappointing.
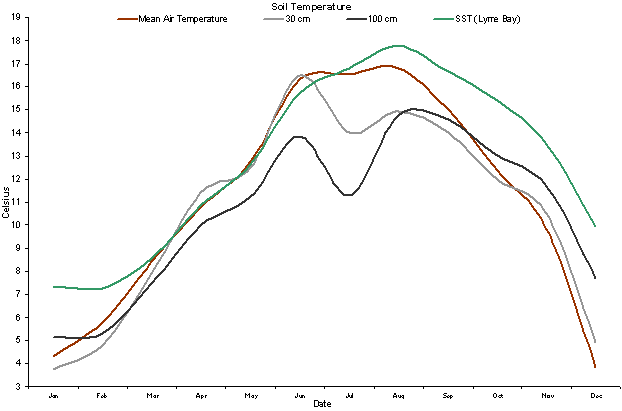
Soil temperatures started the year below normal but gradually recovered through the spring and into early summer then they dropped below the average during mid-late summer.
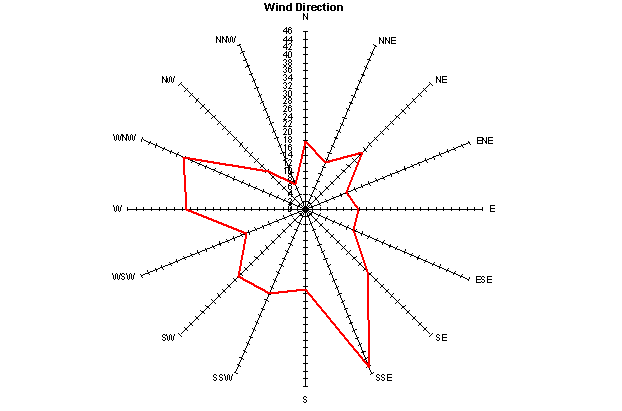
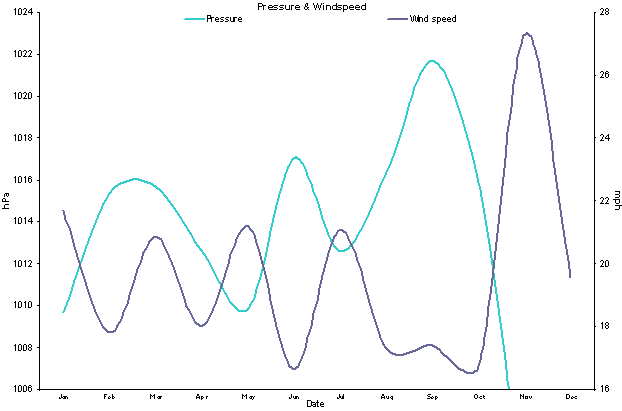
It was not a particularly windy year but there was a notable storm on the 8th of March. This was the only real gale. Winds dominated from the usual westerly sector though winds from the south-east were rather more common than the average due to high number of days with a sea breeze.
Much more frostier than 2007 and 2008.
Sea temperatures were generally around or slightly below average, especially during the latter half of the summer and into the autumn.
Overall pressure was below the LTA and is indicative of the unsettled nature of this year, especially from July onwards.
Dewpoints failed to reach their normal highs during the summer and overall were below normal.
 

Humidity was below normal despite this being a wet year.

 
Figure 1. Temperature and Rainfall for 2009.
Figure 2. Sunshine and air pressure for 2009.
Figure 3. Wind direction for 2009.
Figure 4. Soil & sea surface temperature (SST) for Lyme Bay for 2009.
Figure 5. Windspeed and mean pressure for 2009.