|
January 2010 |
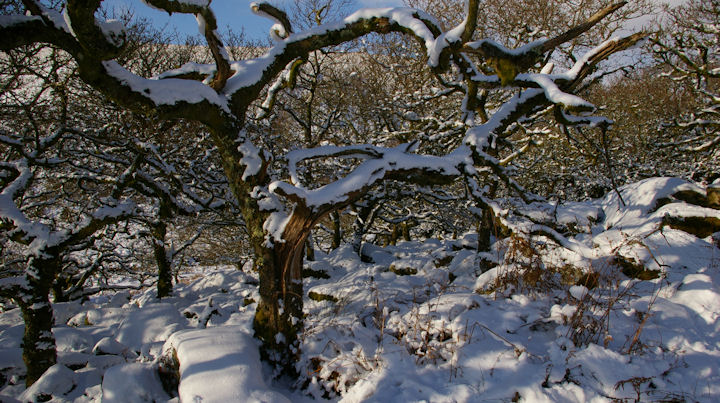
A snowy January scene in the enchanted
Wistman's Wood on Dartmoor. |
|
Summary for |
January
2010 |
|
Mean Max: |
4.9ºC |
(-3.5ºC) |
|
Mean Min: |
-1.1ºC |
(-3.8ºC) |
|
Mean: |
1.9ºC |
(-3.7ºC) |
|
|
|
|
|
High Max: |
10.7ºC |
16th |
|
Low Max: |
-0.7ºC |
7th |
|
High Min: |
7.7ºC |
22nd |
|
Low Min: |
-10.7ºC |
7th |
|
Mean Grass Min: |
-4.0ºC |
|
|
Grass Min: |
-15.8ºC |
7th |
|
|
|
|
|
Rain Total (gauge): |
102.8 mm |
(118%) |
|
Rain Total (tipping bucket): |
88.1 mm |
(101%) |
|
Rain Days >0.2 mm: |
9 Days |
|
|
Rain Days >1.0 mm: |
7 Days |
|
|
Max 24 hrs: |
33.4 mm |
16th |
|
Days without any rain: |
22 |
|
|
|
|
|
|
Air Frost: |
16 Days |
|
|
Ground Frost: |
24 Days |
|
|
Snow Falling: |
2 Days |
|
|
Snow (50%) @ 9am: |
6 Days |
|
|
Thunder Heard: |
0 Days |
|
|
Hail <5 mm: |
0 Days |
|
|
Hail >5 mm: |
0 Days |
|
|
Fog @ 9am: |
0 Days |
|
|
|
|
|
|
Total Monthly Sunshine: |
88h:45m |
|
|
Total Monthly Sunshine: |
88.5 Hours |
|
|
Most Sunshine in a Day: |
08h:45m |
30th |
|
Average Daily Sunshine: |
02h:51m |
|
|
Sunless Days: |
4 Days |
|
|
Cloudless Days: |
8 Days |
|
|
Total Possible Sunshine: |
264h:53m |
|
|
Percentage of Total Sun: |
34% |
|
|
|
|
|
|
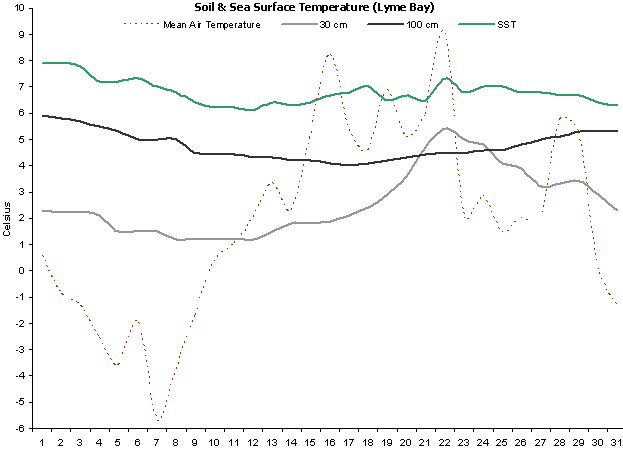
Mean Soil Temp @ 30 cm: |
2.6ºC |
|
|
Min Soil Temp @ 30 cm: |
1.2ºC |
8th |
|
Max Soil Temp @ 30 cm: |
5.4ºC |
22nd |
|
Mean Soil Temp @ 100 cm: |
4.8ºC |
|
|
Min Soil Temp @ 100 cm: |
4.0ºC |
17th |
|
Max Soil Temp @ 100 cm: |
5.9ºC |
1st |
|
|
|
|
|
Mean 10 Min Wind >39 mph: |
0.00 Days |
|
|
N: |
7.13 Days |
|
|
NE: |
3.92 Days |
|
|
E: |
3.99 Days |
|
|
SE: |
2.76 Days |
|
|
S: |
0.35 Days |
|
|
SW: |
1.06 Days |
|
|
W: |
4.26 Days |
|
|
NW: |
3.44 Days |
|
|
Calm: |
4.09 Days |
|
|
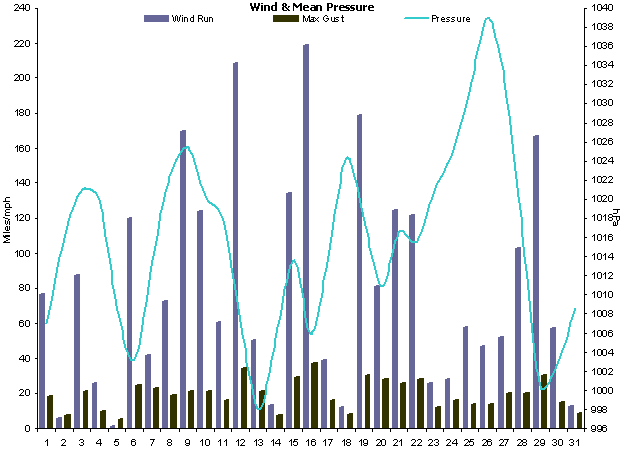
Mean Wind: |
3.4 mph |
|
|
Max Gust: |
37 mph |
16th |
|
|
|
|
|
Mean Cloud Cover: |
73% |
|
|
Mean RH @ 9am: |
88% |
|
|
Rain Duration >0.1mm/hour: |
50.0 Hours |
|
|
Frost Duration: |
238.3 Hours |
|
|
Max Frost Duration in a Day: |
24.0 Hours |
7th |
|
|
|
|
|
Mean Sea Temperature: |
6.8ºC |
|
|
Normal for Month: |
|
|
|
Max Sea Temperature: |
7.9ºC |
1st |
|
Min Sea Temperature: |
6.1ºC |
12th |
|
|
|
|
|
Mean Pressure @ 9am: |
1016.2 hPa |
(+0.9 hPa) |
|
Mean Pressure: |
1015.5 hPa |
(+0.2 hPa) |
|
Max Pressure: |
1041.6 hPa |
26th |
|
Min Pressure: |
992.1 hPa |
29th |
|
|
|
|
|
Max Dewpoint: |
9.2ºC |
16th |
|
Min Dewpoint: |
-13.0ºC |
7th |
|
Mean Dewpoint: |
-0.7ºC |
|
|
|
|
|
|
Max Humidity: |
93% |
15th |
|
Min Humidity: |
61% |
30th |
|
Mean Humidity: |
86% |
(-0) |
|
|
A
very cold and often wet month with some snowfall though
frequently quite sunny.
Both
minimum and maximum temperatures were way below normal
in what was a very cold month. There was a station
record frost on the 7th of January with -10.7°C. On that
day the temperatures also failed to get above freezing
which is the first 'ice day' recorded at this station. |
|
Overall rainfall was
rather wetter than normal with 118%. Even so, there were
only 7 'rain' days as the rain tended to come in heavy
downpours. |
|
Snow lay
on the ground for 6 days from the 6th to the 11th. There
were 16 air frosts, this is another station record. |
|
Sunshine
levels were a little above average and there were 8
cloudless days. |
|
Soil temperatures were
well below normal throughout. |
|
Winds were dominant from
the north. Brrrrr!!!! |
|
Rainfall duration for the
whole month was a very low despite rainfall being above
average. |
|
Sea temperatures fell
during the first two weeks then rose slightly
thereafter. |
|
Mean pressure was just a
little higher than normal. |
|
Dewpoints were well below
normal due to frequent incursions of very dry and cold,
Continental air. |
|
The RH ended up being normal. |
|
|
|
Weather Data for Otter Valley, Devon. |
January 2010 |
|
|
|
Temp (oC) |
Hum (RH%) |
Dewpoint (oC) |
Wind (mph) |
Rain |
Pressure (hPa) |
Grass |
Sun |
|
|
|
Min |
Max |
Ave |
Min |
Max |
Ave |
Min |
Max |
Ave |
Max |
Ave |
Run |
mm |
Min |
Max |
Ave |
Min |
Hours |
Observations |
|
1 |
-1.9 |
3.1 |
0.6 |
71 |
86 |
79 |
-7.4 |
-1.3 |
-4.4 |
18 |
3.2 |
77 |
0.0 |
1002 |
1012 |
1007 |
-3.6 |
7.7 |
Sunny all day |
|
2 |
-6.4 |
4.7 |
-0.9 |
85 |
91 |
88 |
-8.3 |
2.3 |
-3.0 |
7 |
0.2 |
6 |
0.0 |
1012 |
1020 |
1016 |
-8.8 |
7.5 |
Sunny all day |
|
3 |
-5.6 |
3.0 |
-1.3 |
74 |
91 |
83 |
-7.6 |
-0.5 |
-4.1 |
21 |
3.6 |
87 |
0.0 |
1019 |
1023 |
1021 |
-9.5 |
7.2 |
Sunny all day |
|
4 |
-7.2 |
2.1 |
-2.6 |
73 |
89 |
81 |
-9.4 |
-2.0 |
-5.7 |
10 |
1.1 |
26 |
0.0 |
1016 |
1024 |
1020 |
-11.3 |
7.7 |
Sunny all day |
|
5 |
-8.9 |
1.7 |
-3.6 |
85 |
91 |
88 |
-11.1 |
0.0 |
-5.6 |
5 |
0.1 |
1 |
0.9 |
1000 |
1016 |
1008 |
-11.9 |
0.6 |
Sleet showers am, bright pm |
|
6 |
-4.7 |
0.8 |
-2.0 |
80 |
91 |
86 |
-6.4 |
-1.0 |
-3.7 |
25 |
5.0 |
120 |
0.0 |
997 |
1009 |
1003 |
-6.2 |
0.2 |
Snow am, bright pm |
|
7 |
-10.7 |
-0.7 |
-5.7 |
80 |
89 |
85 |
-13.0 |
-4.0 |
-8.5 |
23 |
1.7 |
42 |
0.0 |
1009 |
1018 |
1014 |
-15.8 |
7.8 |
Sunny all day. |
|
8 |
-7.9 |
0.4 |
-3.8 |
77 |
90 |
84 |
-10.1 |
-3.2 |
-6.7 |
19 |
3.0 |
73 |
0.0 |
1018 |
1027 |
1022 |
-14.6 |
4.9 |
Sunny intervals all day. |
|
9 |
-3.2 |
-0.2 |
-1.7 |
75 |
85 |
80 |
-5.7 |
-4.2 |
-5.0 |
21 |
7.1 |
170 |
0.0 |
1024 |
1027 |
1025 |
-6.2 |
7.5 |
Sunny all day. |
|
10 |
-0.8 |
1.5 |
0.4 |
80 |
84 |
82 |
-5.4 |
-1.1 |
-3.3 |
21 |
5.1 |
124 |
0.0 |
1017 |
1024 |
1020 |
-4.5 |
0.0 |
Snow flurries am, cloudy pm |
|
11 |
0.2 |
1.9 |
1.1 |
84 |
89 |
87 |
-2.0 |
-0.6 |
-1.3 |
16 |
2.5 |
61 |
0.0 |
1017 |
1019 |
1018 |
-1.2 |
0.0 |
Cloudy all day |
|
12 |
1.3 |
2.8 |
2.1 |
78 |
90 |
84 |
-1.8 |
0.4 |
-0.7 |
34 |
8.7 |
208 |
11.1 |
997 |
1018 |
1007 |
0.1 |
0.2 |
Sunny ints am, rain pm |
|
13 |
1.0 |
5.6 |
3.3 |
90 |
92 |
91 |
-0.7 |
4.2 |
1.8 |
21 |
2.1 |
50 |
6.1 |
996 |
1000 |
998 |
-0.6 |
0.1 |
Cloudy am, bright pm |
|
14 |
0.7 |
3.9 |
2.3 |
91 |
92 |
92 |
-0.8 |
2.5 |
0.9 |
7 |
0.5 |
13 |
0.0 |
999 |
1012 |
1005 |
-1.5 |
0.0 |
Dull all day |
|
15 |
1.1 |
9.0 |
5.1 |
89 |
93 |
91 |
-1.3 |
7.4 |
3.1 |
29 |
5.6 |
134 |
0.4 |
1012 |
1015 |
1014 |
0.3 |
0.3 |
Dull am, bright pm |
|
16 |
5.8 |
10.7 |
8.3 |
87 |
93 |
90 |
3.9 |
9.2 |
6.6 |
37 |
9.1 |
219 |
33.4 |
1000 |
1012 |
1006 |
1.2 |
2.2 |
Rain am, sunny intervals pm |
|
17 |
0.4 |
10.3 |
5.4 |
78 |
93 |
86 |
-1.0 |
7.2 |
3.1 |
16 |
1.6 |
39 |
0.0 |
1005 |
1023 |
1014 |
-2.3 |
7.4 |
Sunny all day |
|
18 |
0.2 |
9.0 |
4.6 |
88 |
93 |
91 |
-1.5 |
7.7 |
3.1 |
8 |
0.5 |
12 |
0.0 |
1023 |
1026 |
1024 |
-1.9 |
2.4 |
Fog am, sunny intervals pm |
|
19 |
6.1 |
7.6 |
6.9 |
82 |
93 |
88 |
3.0 |
5.2 |
4.1 |
30 |
7.4 |
178 |
0.0 |
1012 |
1025 |
1018 |
2.1 |
1.2 |
Sunny intervals all day |
|
20 |
4.2 |
6.0 |
5.1 |
83 |
91 |
87 |
1.7 |
4.3 |
3.0 |
28 |
3.1 |
81 |
13.5 |
1006 |
1015 |
1011 |
0.3 |
0.2 |
Rain am, bright pm |
|
21 |
3.0 |
8.9 |
6.0 |
90 |
92 |
91 |
1.2 |
7.0 |
4.1 |
26 |
5.2 |
125 |
4.6 |
1014 |
1019 |
1016 |
-0.1 |
0.0 |
Dull all day |
|
22 |
7.7 |
10.4 |
9.1 |
86 |
93 |
90 |
2.2 |
8.8 |
5.5 |
28 |
5.1 |
122 |
14.4 |
1012 |
1019 |
1016 |
3.8 |
0.9 |
Rain am, sunny pm |
|
23 |
-1.7 |
5.8 |
2.1 |
87 |
92 |
90 |
-3.3 |
4.0 |
0.4 |
12 |
1.1 |
26 |
0.0 |
1019 |
1023 |
1021 |
-4.1 |
1.4 |
Cloudy am, sunny ints pm |
|
24 |
-0.7 |
6.4 |
2.9 |
78 |
92 |
85 |
-2.5 |
3.2 |
0.4 |
16 |
1.3 |
28 |
0.0 |
1023 |
1027 |
1025 |
-2.6 |
5.2 |
Sunny intervals all day |
|
25 |
-1.7 |
4.7 |
1.5 |
81 |
92 |
87 |
-3.4 |
1.9 |
-0.8 |
14 |
2.4 |
57 |
0.0 |
1026 |
1036 |
1031 |
-3.2 |
1.7 |
Sunny intervals all day |
|
26 |
1.2 |
2.8 |
2.0 |
75 |
88 |
82 |
-4.0 |
0.0 |
-2.0 |
14 |
2.0 |
47 |
0.0 |
1036 |
1042 |
1039 |
-0.8 |
0.3 |
Brief sunny intervals all day |
|
27 |
-3.2 |
7.2 |
2.0 |
84 |
90 |
87 |
-5.5 |
5.2 |
-0.2 |
20 |
2.2 |
52 |
0.0 |
1023 |
1041 |
1032 |
-6.2 |
1.9 |
Sunny am, cloudy pm |
|
28 |
3.6 |
7.9 |
5.8 |
77 |
91 |
84 |
0.9 |
5.9 |
3.4 |
20 |
4.3 |
103 |
0.0 |
1009 |
1023 |
1016 |
0.1 |
0.2 |
Cloudy am, sunny ints pm |
|
29 |
3.1 |
7.3 |
5.2 |
67 |
92 |
80 |
-2.4 |
5.5 |
1.6 |
30 |
6.9 |
167 |
3.7 |
992 |
1009 |
1000 |
-0.3 |
1.8 |
Rain am, sunny intervals pm |
|
30 |
-4.4 |
4.7 |
0.2 |
61 |
89 |
75 |
-6.7 |
-1.4 |
-4.1 |
15 |
2.4 |
57 |
0.0 |
999 |
1007 |
1003 |
-6.7 |
8.5 |
Sunny all day |
|
31 |
-6.2 |
3.6 |
-1.3 |
83 |
91 |
87 |
-8.3 |
1.2 |
-3.6 |
9 |
0.6 |
12 |
0.0 |
1007 |
1010 |
1009 |
-8.5 |
1.7 |
Sunny intervals all day |
|
|
-1.1 |
4.9 |
1.9 |
81 |
91 |
86 |
-3.8 |
2.5 |
-0.7 |
19 |
3.4 |
2514 |
88.1 |
1011 |
1020 |
1015 |
-4.0 |
88.48 |
|
|
|
Graphs for
January 2010 |
 |
|
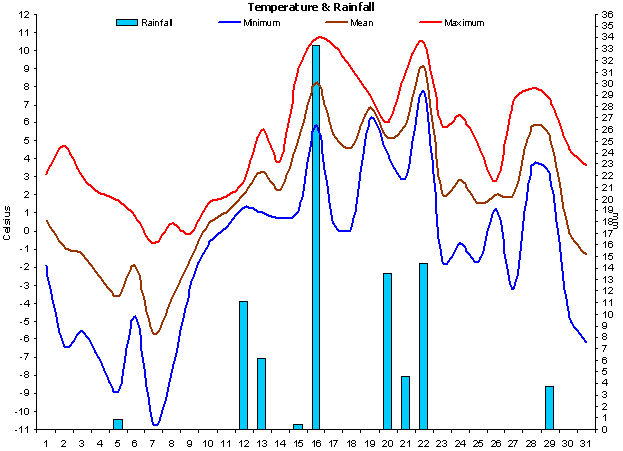
Figure 1. Temperature and
Rainfall for January 2010. |
 |
|
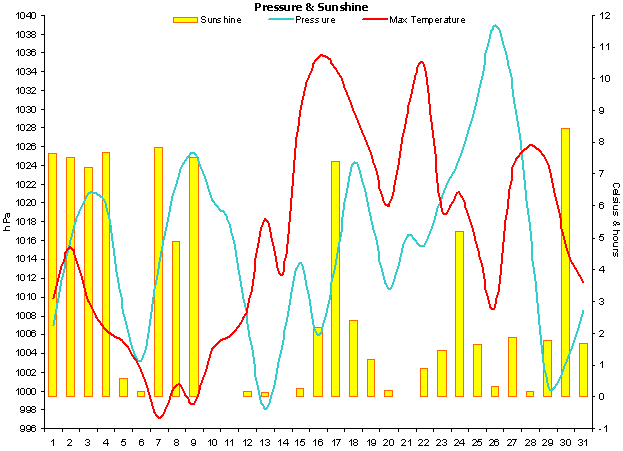
Figure 2. Sunshine, air
pressure and mean wind speed for January 2010. |
 |
|
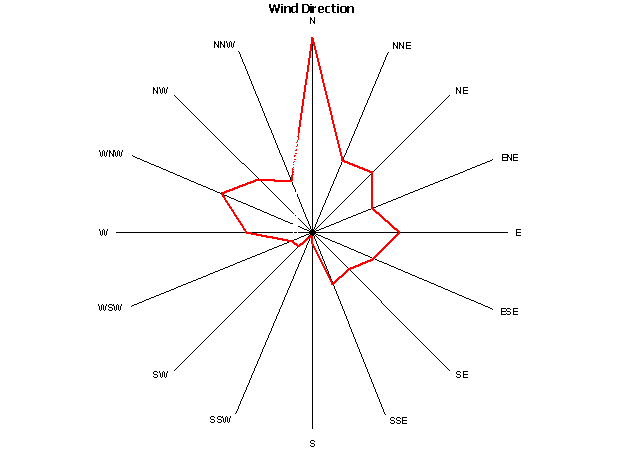
Figure 3.
Wind direction for January 2010. |
 |
|
Figure 4. Soil & sea
surface temperature (SST) for Lyme Bay for January 2010. |
 |
|
Figure 5.
Wind run, maximum
gusts and mean
pressure for January 2010. |
|