|
May 2010 |
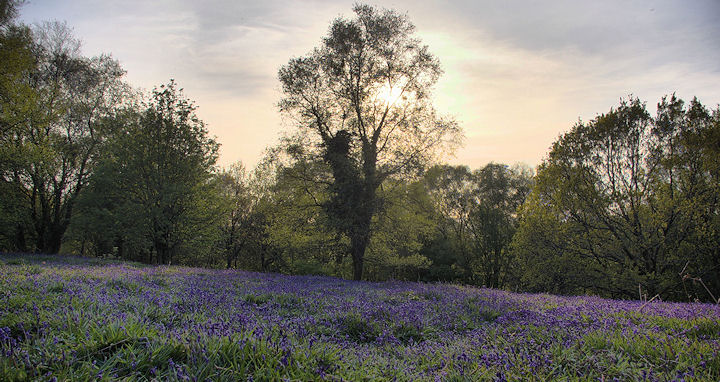
Bluebells in Gittisham Woods on a warm
and sunny May evening. |
|
Summary for |
May
2010 |
|
Mean Max: |
18.1ºC |
(+2.1ºC) |
|
Mean Min: |
6.6ºC |
(-0.7ºC) |
|
Mean: |
12.3ºC |
(+0.7ºC) |
|
|
|
|
|
High Max: |
29.1ºC |
24th |
|
Low Max: |
11.1ºC |
9th |
|
High Min: |
13.1ºC |
20th |
|
Low Min: |
0.1ºC |
12th |
|
Mean Grass Min: |
3.8ºC |
|
|
Grass Min: |
-3.4ºC |
12th |
|
|
|
|
|
Rain Total (gauge): |
23.7 mm |
(42%) |
|
Rain Total (tipping bucket): |
23.5 mm |
(41%) |
|
Rain Days >0.2 mm: |
7 Days |
|
|
Rain Days >1.0 mm: |
6 Days |
|
|
Max 24 hrs: |
6.1 mm |
29th |
|
Days without any rain: |
24 |
|
|
|
|
|
|
Air Frost: |
0 Days |
|
|
Ground Frost: |
5 Days |
|
|
Snow Falling: |
0 Days |
|
|
Snow (50%) @ 9am: |
0 Days |
|
|
Thunder Heard: |
0 Days |
|
|
Hail <5 mm: |
0 Days |
|
|
Hail >5 mm: |
0 Days |
|
|
Fog @ 9am: |
0 Days |
|
|
|
|
|
|
Total Monthly Sunshine: |
204h:56m |
|
|
Total Monthly Sunshine: |
205.0 Hours |
|
|
Most Sunshine in a Day: |
15h:20m |
24th |
|
Average Daily Sunshine: |
06h:36m |
|
|
Sunless Days: |
2 Days |
|
|
Cloudless Days: |
3 Days |
|
|
Total Possible Sunshine: |
481h:22m |
|
|
Percentage of Total Sun: |
43% |
|
|
|
|
|
|
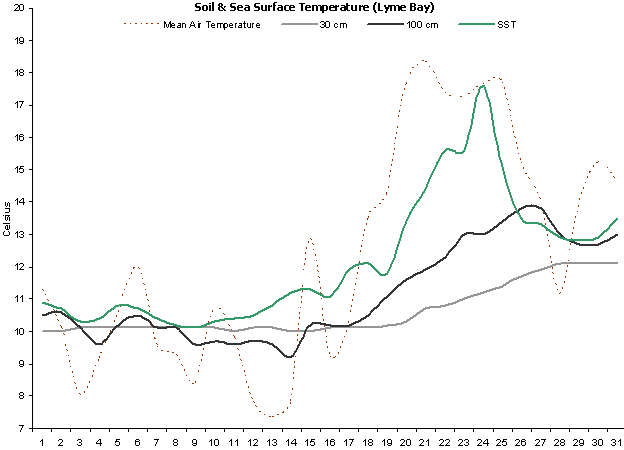
Mean Soil Temp @ 30 cm: |
10.6ºC |
|
|
Min Soil Temp @ 30 cm: |
10.0ºC |
1st |
|
Max Soil Temp @ 30 cm: |
12.1ºC |
28th |
|
Mean Soil Temp @ 100 cm: |
11.1ºC |
|
|
Min Soil Temp @ 100 cm: |
9.2ºC |
14th |
|
Max Soil Temp @ 100 cm: |
13.8ºC |
26th |
|
|
|
|
|
Mean 10 Min Wind >39 mph: |
0.00 Days |
|
|
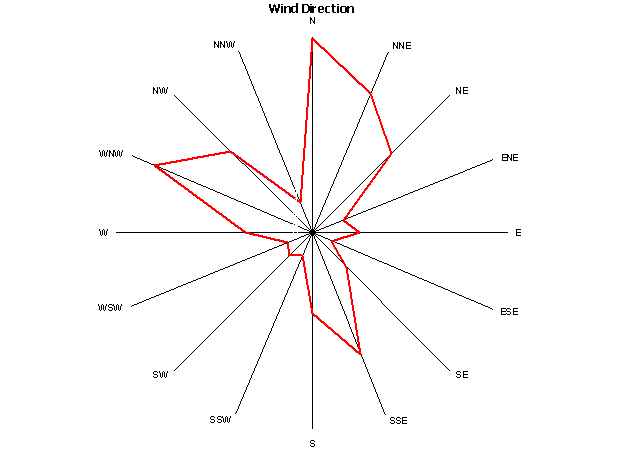
N: |
7.54 Days |
|
|
NE: |
3.22 Days |
|
|
E: |
1.49 Days |
|
|
SE: |
3.93 Days |
|
|
S: |
2.29 Days |
|
|
SW: |
1.26 Days |
|
|
W: |
5.21 Days |
|
|
NW: |
3.22 Days |
|
|
Calm: |
2.84 Days |
|
|
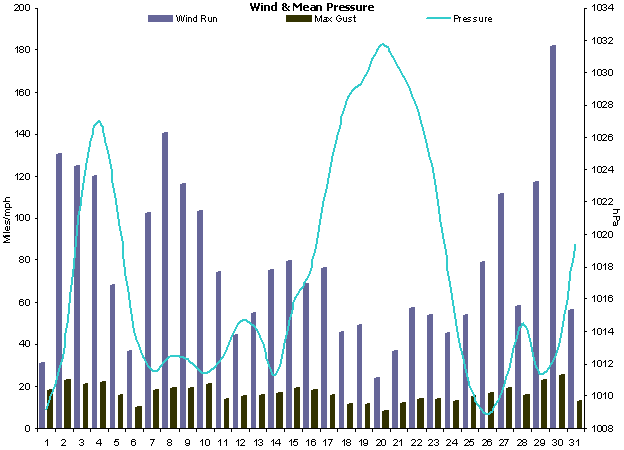
Mean Wind: |
3.3 mph |
|
|
Max Gust: |
25 mph |
30th |
|
|
|
|
|
Mean Cloud Cover: |
62% |
|
|
Mean RH @ 9am: |
72% |
|
|
Rain Duration >0.1mm/hour: |
15.8 Hours |
|
|
Frost Duration: |
0.0 Hours |
|
|
Max Frost Duration in a Day: |
0.0 Hours |
|
|
|
|
|
|
Mean Sea Temperature: |
12.1ºC |
|
|
Normal for Month: |
|
|
|
Max Sea Temperature: |
17.6ºC |
24th |
|
Min Sea Temperature: |
10.1ºC |
9th |
|
|
|
|
|
Mean Pressure @ 9am: |
1017.6 hPa |
(+1.8 hPa) |
|
Mean Pressure: |
1017.4 hPa |
(+1.6 hPa) |
|
Max Pressure: |
1032.8 hPa |
20th |
|
Min Pressure: |
1006.4 hPa |
29th |
|
|
|
|
|
Max Dewpoint: |
15.8ºC |
21st |
|
Min Dewpoint: |
-3.5ºC |
12th |
|
Mean Dewpoint: |
5.8ºC |
|
|
|
|
|
|
Max Humidity: |
92% |
21st |
|
Min Humidity: |
31% |
23rd |
|
Mean Humidity: |
70% |
(-7) |
|
|
A dry,
generally sunny and warm month.
The first half of the month was dominated by cool nights
and reasonably warm days. From mid-month onwards the
temperatures climbed both day and night with a notable
hot spell from the 20th to the 25th. The
temperature peaked at 29.1°C on the 24th making it the
hottest May day in the record, and the highest
temperature since the 25th August 2007.
Slightly
cooler than May 2009, mostly due to the prevalence of
chilly nights for the first half of the month. |
|
Rainfall was generally
light and fell on just a few days through the month. |
|
There were
no air frosts though there were quite a few grass
frosts. |
|
Sunnier
than May 2007, 08 & 09. |
|
Soil temperatures were
below normal throughout because of the cold winter,
though they recovered somewhat from mid-month onwards. |
|
Winds were dominant from
the north and north-west sectors, though towards the end
of the month the dominant direction was SSE due to frequent sea
breezes. |
|
Rainfall duration was just
15.8 hours. |
|
Sea temperatures rose
slowly throughout the month but still remained slightly below
normal. |
|
Mean pressure was above normal
thanks to the anticyclonic, settled weather that
dominated most of this month. |
|
Dewpoints were below
normal due to frequent incursions of very dry,
Arctic air. |
|
The RH ended up being
well below normal. |
|
|
|
Weather Data for Otter Valley, Devon. |
May 2010 |
|
|
|
Temp (oC) |
Hum (RH%) |
Dewpoint (oC) |
Wind (mph) |
Rain |
Pressure (hPa) |
Grass |
Sun |
|
|
|
Min |
Max |
Ave |
Min |
Max |
Ave |
Min |
Max |
Ave |
Max |
Ave |
Run |
mm |
Min |
Max |
Ave |
Min |
Hours |
Observations |
|
1 |
7.5 |
15.1 |
11.3 |
68 |
90 |
79 |
5.0 |
9.3 |
7.2 |
18 |
1.3 |
31 |
3.8 |
1008 |
1010 |
1009 |
4.3 |
0.9 |
Sunny ints am, showers pm |
|
2 |
7.1 |
13.1 |
10.1 |
62 |
90 |
76 |
2.6 |
6.8 |
4.7 |
23 |
5.4 |
130 |
2.3 |
1008 |
1018 |
1013 |
4.7 |
1.3 |
Rain am, then sunny ints |
|
3 |
2.6 |
13.5 |
8.1 |
47 |
84 |
66 |
-0.5 |
3.5 |
1.5 |
21 |
5.2 |
125 |
0.0 |
1018 |
1027 |
1023 |
-0.5 |
9.9 |
Sunny intervals all day |
|
4 |
2.4 |
15.9 |
9.2 |
44 |
86 |
65 |
-0.7 |
3.9 |
1.6 |
22 |
5.0 |
120 |
0.0 |
1025 |
1029 |
1027 |
0.6 |
10.8 |
Sunny intervals all day |
|
5 |
3.3 |
17.9 |
10.6 |
45 |
86 |
66 |
0.1 |
7.6 |
3.9 |
16 |
2.8 |
68 |
0.0 |
1017 |
1026 |
1021 |
0.4 |
3.5 |
Sunny intervals all day |
|
6 |
9.6 |
14.4 |
12.0 |
73 |
88 |
81 |
6.1 |
10.3 |
8.2 |
10 |
1.5 |
37 |
2.3 |
1011 |
1017 |
1014 |
6.2 |
1.9 |
Sun & showers all day |
|
7 |
6.3 |
12.8 |
9.6 |
57 |
80 |
69 |
0.9 |
6.2 |
3.6 |
18 |
4.3 |
102 |
0.0 |
1011 |
1013 |
1012 |
3.1 |
2.9 |
Brief sunny intervals all day |
|
8 |
6.5 |
12.1 |
9.3 |
67 |
81 |
74 |
1.6 |
6.0 |
3.8 |
19 |
5.9 |
141 |
0.0 |
1012 |
1013 |
1012 |
3.1 |
0.3 |
Brief sunny intervals all day |
|
9 |
5.7 |
11.1 |
8.4 |
66 |
84 |
75 |
2.5 |
4.8 |
3.7 |
19 |
4.8 |
116 |
0.0 |
1011 |
1014 |
1012 |
3.1 |
1.5 |
Brief sunny intervals all day |
|
10 |
4.7 |
16.7 |
10.7 |
41 |
83 |
62 |
1.3 |
4.5 |
2.9 |
21 |
4.3 |
103 |
0.0 |
1011 |
1012 |
1011 |
3.4 |
10.6 |
Sunny am, sunny ints pm |
|
11 |
6.5 |
13.1 |
9.8 |
46 |
75 |
61 |
0.6 |
3.5 |
2.1 |
14 |
3.1 |
74 |
0.0 |
1012 |
1013 |
1013 |
5.2 |
1.0 |
Sunny intervals all day |
|
12 |
0.1 |
15.6 |
7.9 |
45 |
88 |
67 |
-3.5 |
3.5 |
0.0 |
15 |
1.9 |
45 |
0.0 |
1014 |
1016 |
1015 |
-3.4 |
7.5 |
Sunny intervals all day |
|
13 |
0.2 |
14.5 |
7.4 |
56 |
90 |
73 |
-2.5 |
5.7 |
1.6 |
16 |
2.3 |
55 |
0.0 |
1012 |
1016 |
1014 |
-2.6 |
7.8 |
Sunny intervals all day |
|
14 |
3.9 |
11.8 |
7.9 |
66 |
88 |
77 |
1.1 |
6.0 |
3.6 |
17 |
3.1 |
75 |
0.6 |
1009 |
1014 |
1011 |
0.8 |
0.0 |
Cloudy all day |
|
15 |
8.1 |
17.6 |
12.9 |
43 |
89 |
66 |
2.1 |
7.0 |
4.6 |
19 |
3.3 |
80 |
0.0 |
1014 |
1018 |
1016 |
6.3 |
9.8 |
Sunny intervals all day |
|
16 |
2.7 |
15.7 |
9.2 |
67 |
90 |
79 |
-0.5 |
11.7 |
5.6 |
18 |
2.9 |
69 |
2.9 |
1017 |
1019 |
1018 |
-0.5 |
2.5 |
Sunny ints am, showers pm |
|
17 |
2.3 |
18.2 |
10.3 |
49 |
91 |
70 |
-0.2 |
9.2 |
4.5 |
16 |
3.2 |
77 |
0.0 |
1020 |
1027 |
1023 |
-0.5 |
10.8 |
Sunny intervals all day |
|
18 |
6.3 |
20.7 |
13.5 |
51 |
88 |
70 |
1.7 |
10.8 |
6.3 |
11 |
1.9 |
46 |
0.0 |
1027 |
1029 |
1028 |
1.7 |
8.4 |
Sunny intervals all day |
|
19 |
11.1 |
17.4 |
14.3 |
68 |
83 |
76 |
6.9 |
11.5 |
9.2 |
11 |
2.1 |
49 |
0.0 |
1028 |
1031 |
1030 |
9.3 |
0.0 |
Cloudy all day |
|
20 |
13.1 |
22.2 |
17.7 |
61 |
89 |
75 |
9.3 |
14.6 |
12.0 |
8 |
0.9 |
24 |
0.0 |
1031 |
1033 |
1032 |
11.7 |
1.6 |
Brief sunny intervals all day |
|
21 |
8.2 |
28.5 |
18.4 |
43 |
92 |
68 |
5.9 |
15.8 |
10.9 |
12 |
1.5 |
37 |
0.0 |
1029 |
1032 |
1030 |
5.4 |
9.8 |
Sunny am, sunny ints pm |
|
22 |
9.1 |
25.7 |
17.4 |
45 |
90 |
68 |
6.2 |
14.6 |
10.4 |
14 |
2.4 |
57 |
0.0 |
1026 |
1030 |
1028 |
5.9 |
15.2 |
Sunny all day |
|
23 |
7.1 |
27.4 |
17.3 |
31 |
90 |
61 |
4.0 |
13.8 |
8.9 |
14 |
2.3 |
54 |
0.0 |
1020 |
1027 |
1023 |
4.1 |
15.3 |
Sunny all day |
|
24 |
6.2 |
29.1 |
17.7 |
31 |
83 |
57 |
1.6 |
13.2 |
7.4 |
13 |
2.1 |
45 |
0.0 |
1012 |
1020 |
1016 |
3.2 |
15.3 |
Sunny all day |
|
25 |
9.6 |
25.8 |
17.7 |
50 |
86 |
68 |
5.7 |
15.0 |
10.4 |
15 |
2.3 |
54 |
0.0 |
1009 |
1013 |
1011 |
5.4 |
12.5 |
Sunny am, sunny ints pm |
|
26 |
10.1 |
20.4 |
15.3 |
51 |
79 |
65 |
4.9 |
10.5 |
7.7 |
17 |
3.3 |
79 |
0.0 |
1008 |
1010 |
1009 |
6.5 |
8.8 |
Sunny intervals all day |
|
27 |
10.7 |
17.3 |
14.0 |
42 |
87 |
65 |
2.4 |
8.5 |
5.5 |
19 |
4.6 |
111 |
5.5 |
1009 |
1013 |
1011 |
9.3 |
12.7 |
Sunny intervals all day |
|
28 |
4.1 |
18.2 |
11.2 |
47 |
90 |
69 |
0.8 |
8.7 |
4.8 |
16 |
2.4 |
58 |
0.0 |
1013 |
1016 |
1015 |
1.3 |
7.0 |
Sunny am, cloudy pm |
|
29 |
10.4 |
17.4 |
13.9 |
66 |
91 |
79 |
3.4 |
13.4 |
8.4 |
23 |
4.9 |
117 |
6.1 |
1006 |
1016 |
1011 |
3.1 |
1.1 |
Sunny am, showers pm |
|
30 |
11.8 |
18.7 |
15.3 |
50 |
88 |
69 |
4.5 |
10.7 |
7.6 |
25 |
7.6 |
182 |
0.0 |
1009 |
1018 |
1013 |
12.3 |
5.4 |
Sunny intervals all day |
|
31 |
7.6 |
21.7 |
14.7 |
50 |
85 |
68 |
3.8 |
10.7 |
7.3 |
13 |
2.8 |
56 |
0.0 |
1018 |
1021 |
1019 |
4.7 |
9.0 |
Sunny intervals all day |
|
|
6.6 |
18.1 |
12.3 |
53 |
87 |
70 |
2.5 |
9.1 |
6.0 |
17 |
3.3 |
2413 |
23.5 |
1015 |
1020 |
1017 |
3.8 |
205.0 |
|
|
|
Graphs for
May 2010 |
 |
|
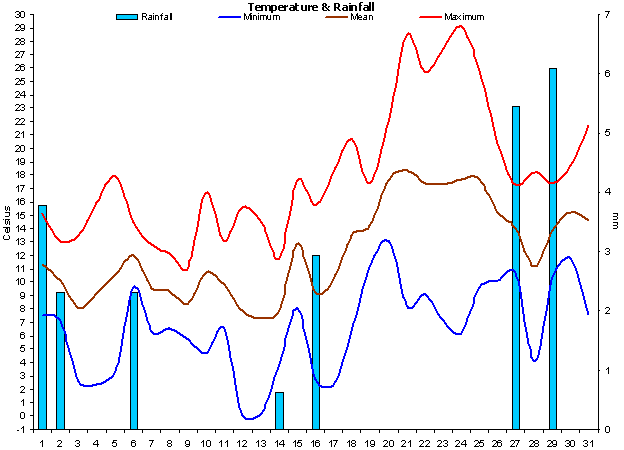
Figure 1. Temperature and
Rainfall for May 2010. |
 |
|
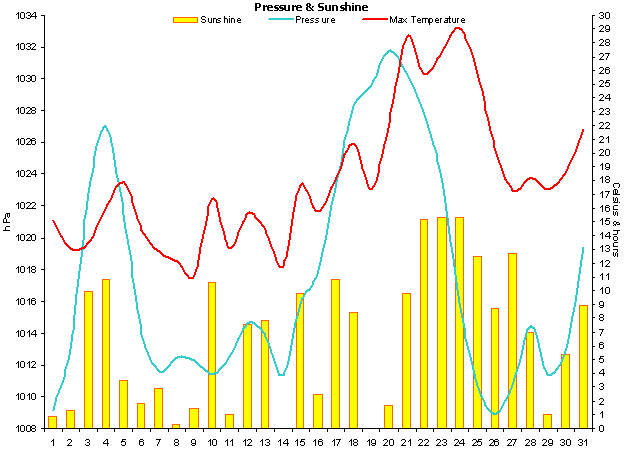
Figure 2. Sunshine, air
pressure and mean wind speed for May 2010. |
 |
|
Figure 3.
Wind direction for May 2010. |
 |
|
Figure 4. Soil & sea
surface temperature (SST) for Lyme Bay for May 2010. |
 |
|
Figure 5.
Wind run,
maximum gusts and mean pressure for May 2010. |
|