|
November 2010 |

Autumn colour in the Otter Valley,
Devon. |
|
Summary for |
November
2010 |
|
Mean Max: |
9.7ºC |
(-1.7ºC) |
|
Mean Min: |
3.1ºC |
(-1.9ºC) |
|
Mean: |
6.4ºC |
(-1.6ºC) |
|
|
|
|
|
High Max: |
18.1ºC |
4th |
|
Low Max: |
-0.9ºC |
28th |
|
High Min: |
14.8ºC |
5th |
|
Low Min: |
-4.9ºC |
26th |
|
Mean Grass Min: |
0.5ºC |
|
|
Grass Min: |
-6.6ºC |
29th |
|
|
|
|
|
Rain Total (gauge): |
101.5 mm |
(162%) |
|
Rain Total (tipping bucket): |
88.4 mm |
(142%) |
|
Rain Days >0.2 mm: |
20 Days |
|
|
Rain Days >1.0 mm: |
11 Days |
|
|
Max 24 hrs: |
37.2 mm |
17th |
|
Days without any rain: |
10 |
|
|
|
|
|
|
Air Frost: |
9 Days |
|
|
Ground Frost: |
7 Days |
|
|
Snow Falling: |
0 Days |
|
|
Snow (50%) @ 9am: |
0 Days |
|
|
Thunder Heard: |
0 Days |
|
|
Hail <5 mm: |
0 Days |
|
|
Hail >5 mm: |
0 Days |
|
|
Fog @ 9am: |
1 Day |
1st |
|
|
|
|
|
Total Monthly Sunshine: |
107h:31m |
|
|
Total Monthly Sunshine: |
107.5 Hours |
|
|
Most Sunshine in a Day: |
08h:40m |
10th |
|
Average Daily Sunshine: |
03h:35m |
|
|
Sunless Days: |
1 Days |
|
|
Cloudless Days: |
5 Days |
|
|
Total Possible Sunshine: |
269h:21m |
|
|
Percentage of Total Sun: |
40% |
|
|
|
|
|
|
Mean Soil Temp @ 30 cm: |
|
|
|
Min Soil Temp @ 30 cm: |
|
|
|
Max Soil Temp @ 30 cm: |
12.3ºC |
5th |
|
Mean Soil Temp @ 100 cm: |
|
|
|
Min Soil Temp @ 100 cm: |
|
|
|
Max Soil Temp @ 100 cm: |
11.8ºC |
5th |
|
|
|
|
|
Mean 10 Min Wind >39 mph: |
0.00 Days |
|
|
N: |
7.40 Days |
|
|
NE: |
2.19 Days |
|
|
E: |
2.20 Days |
|
|
SE: |
1.71 Days |
|
|
S: |
2.61 Days |
|
|
SW: |
2.89 Days |
|
|
W: |
3.32 Days |
|
|
NW: |
2.51 Days |
|
|
Calm: |
6.18 Days |
|
|
Mean Wind: |
3.9 mph |
|
|
Max Gust: |
40 mph |
17th |
|
|
|
|
|
Mean Cloud Cover: |
68% |
|
|
Mean RH @ 9am: |
85% |
|
|
Rain Duration >0.1mm/hour: |
44.5 Hours |
|
|
Frost Duration: |
112.8 Hours |
|
|
Max Frost Duration in a Day: |
24.0 Hours |
28th |
|
|
|
|
|
Mean Sea Temperature: |
12.3ºC |
|
|
Normal for Month: |
|
|
|
Max Sea Temperature: |
13.8ºC |
6th |
|
Min Sea Temperature: |
10.0ºC |
29th |
|
|
|
|
|
Mean Pressure @ 9am: |
|
|
|
Mean Pressure: |
1005.9 hPa |
(-9.8 hPa) |
|
Max Pressure: |
1021.4 hPa |
16th |
|
Min Pressure: |
963.0 hPa |
9th |
|
|
|
|
|
Max Dewpoint: |
14.1ºC |
5th |
|
Min Dewpoint: |
-7.4ºC |
28th |
|
Mean Dewpoint: |
3.4ºC |
|
|
|
|
|
|
Max Humidity: |
93% |
18th |
|
Min Humidity: |
54% |
10th |
|
Mean Humidity: |
84% |
(-2) |
|
|
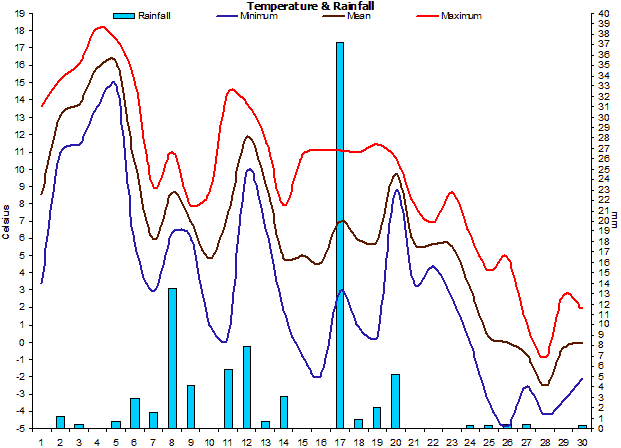
After
a very warm start things started to cool down and the
month ended extremely cold with hard overnight frosts.
Despite a warm start, the
temperatures ended up rather below normal due to the
severity of the cold spell that started on the 21st and
continued to the end of the month. |
|
The month started and
ended dry but was wet around mid-month. There was a very
wet day on the 17th with 45.8 mm of rain. |
|
There
were plenty of cold, frosty nights from the 24th
onwards. Conversely, the night of the 5th was the
warmest for November on record with a minimum of just
14.8°C. |
|
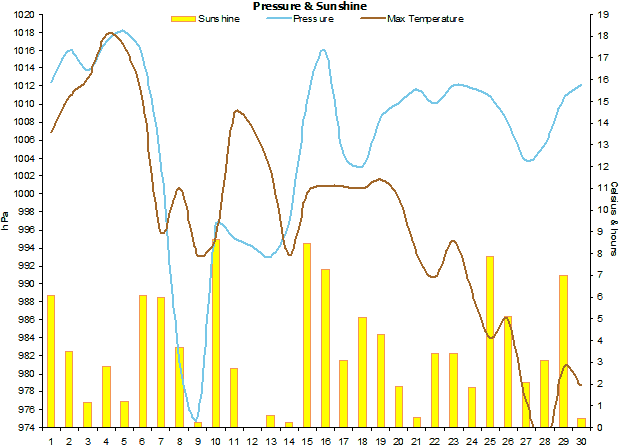
Sunshine
amounts were generally above normal with the sun being
fairly evenly spread throughout the month. |
|
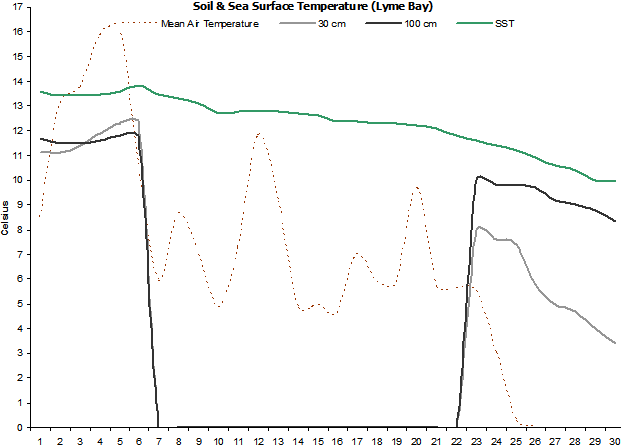
Soil temperatures were
around normal through most of the month but ended up
rather below average due to a few cold nights during the
final week. |
|
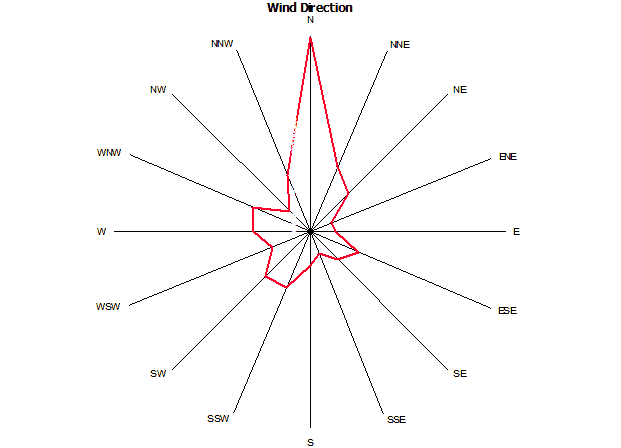
Winds were dominant from a
northerly direction. |
|
Rainfall duration was only 44.5 hours
despite being quite a wet month. |
|
Sea temperatures fell
gradually throughout the month and ended up being rather
below normal due to the cold nights and days at the end
of the month. |
|
Mean pressure was well below
average. |
|
Dewpoints were below
average. |
|
The RH ended up being a
little below normal. |
|
|
|
Weather Data for Otter Valley, Devon. |
November 2010 |
|
|
|
Temp (oC) |
Hum (RH%) |
Dewpoint (oC) |
Wind (mph) |
Rain |
Pressure (hPa) |
Grass |
Sun |
|
|
|
Min |
Max |
Ave |
Min |
Max |
Ave |
Min |
Max |
Ave |
Max |
Ave |
Run |
mm |
Min |
Max |
Ave |
Min |
Hours |
Observations |
|
1 |
3.4 |
13.6 |
8.5 |
84 |
92 |
88 |
1.5 |
11.4 |
6.5 |
0 |
0.0 |
0 |
0.0 |
1008 |
1017 |
1012 |
2.5 |
6.1 |
Foggy am, then sunny |
|
2 |
11.0 |
15.2 |
13.1 |
90 |
92 |
91 |
1.8 |
10.9 |
6.4 |
0 |
0.0 |
0 |
1.1 |
1015 |
1017 |
1016 |
9.1 |
3.5 |
Sunny intervals all day |
|
3 |
11.4 |
16.1 |
13.8 |
85 |
88 |
87 |
12.2 |
12.9 |
12.6 |
0 |
0.0 |
0 |
0.4 |
1013 |
1015 |
1014 |
8.8 |
1.2 |
Sunny ints am, cloudy pm |
|
4 |
13.6 |
18.1 |
15.9 |
79 |
85 |
82 |
10.4 |
13.2 |
11.8 |
0 |
0.0 |
0 |
0.0 |
1016 |
1018 |
1017 |
11.0 |
2.8 |
Sunny intervals all day |
|
5 |
14.8 |
17.5 |
16.2 |
84 |
90 |
87 |
12.7 |
14.1 |
13.4 |
0 |
0.0 |
0 |
0.7 |
1018 |
1019 |
1018 |
10.2 |
1.2 |
Brief sunny intervals all day |
|
6 |
5.8 |
15.1 |
10.5 |
72 |
91 |
82 |
6.9 |
8.7 |
7.8 |
0 |
0.0 |
0 |
2.9 |
1014 |
1016 |
1015 |
7.1 |
6.1 |
Sunny intervals all day |
|
7 |
2.9 |
9.0 |
6.0 |
71 |
90 |
81 |
0.4 |
4.2 |
2.3 |
11 |
0.2 |
5 |
1.5 |
999 |
1008 |
1004 |
0.0 |
5.9 |
Sunny intervals all day |
|
8 |
6.3 |
11.0 |
8.7 |
75 |
91 |
83 |
1.1 |
7.2 |
4.2 |
35 |
3.1 |
67 |
13.4 |
964 |
999 |
981 |
0.0 |
3.7 |
Sunny intervals all day |
|
9 |
6.1 |
7.9 |
7.0 |
79 |
90 |
85 |
2.6 |
5.4 |
4.0 |
0 |
0.0 |
0 |
4.2 |
963 |
987 |
975 |
0.0 |
0.3 |
Rain am, bright pm |
|
10 |
1.0 |
8.7 |
4.9 |
54 |
88 |
71 |
-2.7 |
2.9 |
0.1 |
0 |
0.0 |
0 |
0.0 |
988 |
1005 |
996 |
0.0 |
8.7 |
Sunny all day |
|
11 |
0.2 |
14.4 |
7.3 |
63 |
92 |
78 |
-2.7 |
11.9 |
4.6 |
0 |
0.0 |
0 |
5.7 |
986 |
1004 |
995 |
0.0 |
2.7 |
Rain am, sun & showers pm |
|
12 |
9.8 |
13.8 |
11.8 |
73 |
92 |
83 |
5.5 |
11.7 |
8.6 |
0 |
0.0 |
0 |
7.9 |
991 |
997 |
994 |
0.0 |
0.0 |
Rain intermittent all day |
|
13 |
6.6 |
11.7 |
9.2 |
84 |
89 |
87 |
4.2 |
9.5 |
6.9 |
11 |
0.2 |
6 |
0.7 |
991 |
995 |
993 |
0.0 |
0.5 |
Cloudy am, sunny ints pm |
|
14 |
1.8 |
7.9 |
4.9 |
87 |
91 |
89 |
0.0 |
5.8 |
2.9 |
14 |
1.0 |
24 |
3.1 |
991 |
1003 |
997 |
0.0 |
0.3 |
Cloudy am, rain pm |
|
15 |
-0.8 |
10.8 |
5.0 |
81 |
92 |
87 |
-2.8 |
7.5 |
2.4 |
5 |
0.4 |
10 |
0.0 |
1003 |
1018 |
1011 |
0.0 |
8.4 |
Sunny all day |
|
16 |
-1.9 |
11.1 |
4.6 |
75 |
92 |
84 |
-3.7 |
8.3 |
2.3 |
31 |
3.0 |
73 |
0.0 |
1010 |
1021 |
1016 |
0.0 |
7.2 |
Sunny all day |
|
17 |
2.9 |
11.1 |
7.0 |
76 |
92 |
84 |
1.8 |
9.1 |
5.5 |
40 |
10.4 |
250 |
37.2 |
999 |
1010 |
1004 |
0.0 |
3.1 |
Heavy rain am, very windy |
|
18 |
0.8 |
11.0 |
5.9 |
87 |
93 |
90 |
0.7 |
9.2 |
5.0 |
13 |
1.2 |
30 |
0.9 |
1000 |
1006 |
1003 |
0.0 |
5.1 |
Sunny ints all day |
|
19 |
0.3 |
11.4 |
5.9 |
86 |
93 |
90 |
-1.8 |
9.5 |
3.9 |
12 |
1.7 |
41 |
2.0 |
1007 |
1010 |
1008 |
0.0 |
4.3 |
Sunny ints all day |
|
20 |
8.8 |
10.6 |
9.7 |
86 |
92 |
89 |
4.5 |
8.3 |
6.4 |
19 |
5.9 |
167 |
5.3 |
1008 |
1012 |
1010 |
0.0 |
1.9 |
Sunny ints am, cloudy pm |
|
21 |
3.4 |
8.0 |
5.7 |
80 |
88 |
84 |
0.6 |
4.4 |
2.5 |
17 |
5.2 |
118 |
0.0 |
1011 |
1013 |
1012 |
0.0 |
0.5 |
Sunny ints am, cloudy pm |
|
22 |
4.4 |
6.9 |
5.7 |
83 |
88 |
86 |
0.6 |
4.0 |
2.3 |
14 |
3.8 |
92 |
0.0 |
1009 |
1011 |
1010 |
0.0 |
3.4 |
Sunny ints am, cloudy pm |
|
23 |
2.5 |
8.6 |
5.6 |
78 |
89 |
84 |
0.1 |
4.7 |
2.4 |
11 |
2.2 |
53 |
0.0 |
1010 |
1014 |
1012 |
0.5 |
3.4 |
Sunny intervals all day |
|
24 |
-0.1 |
6.2 |
3.1 |
87 |
91 |
89 |
-2.3 |
4.0 |
0.9 |
7 |
0.7 |
15 |
0.2 |
1010 |
1014 |
1012 |
-1.0 |
1.8 |
Cloudy am, sunny ints pm |
|
25 |
-3.5 |
4.1 |
0.3 |
69 |
91 |
80 |
-5.4 |
-0.5 |
-3.0 |
17 |
2.8 |
68 |
0.2 |
1010 |
1012 |
1011 |
-5.3 |
7.9 |
Sunny all day |
|
26 |
-4.9 |
4.9 |
0.0 |
77 |
91 |
84 |
-7.3 |
1.9 |
-2.7 |
13 |
1.0 |
24 |
0.4 |
1003 |
1013 |
1008 |
-6.5 |
5.1 |
Sunny am, cloudy pm |
|
27 |
-2.6 |
1.2 |
-0.7 |
77 |
89 |
83 |
-4.8 |
-1.4 |
-3.1 |
22 |
6.1 |
146 |
0.4 |
1002 |
1005 |
1004 |
-4.3 |
2.1 |
Sunny ints am, cloudy pm |
|
28 |
-4.2 |
-0.9 |
-2.6 |
74 |
83 |
79 |
-7.4 |
-5.0 |
-6.2 |
19 |
4.1 |
98 |
0.0 |
1004 |
1007 |
1006 |
-6.2 |
3.1 |
Brief sunny intervals all day |
|
29 |
-3.4 |
2.7 |
-0.4 |
68 |
85 |
77 |
-6.5 |
-2.5 |
-4.5 |
22 |
4.8 |
116 |
0.0 |
1007 |
1014 |
1011 |
-6.6 |
7.0 |
Sunny all day |
|
30 |
-2.1 |
1.9 |
-0.1 |
76 |
87 |
82 |
-4.9 |
-1.0 |
-3.0 |
29 |
6.6 |
158 |
0.2 |
1010 |
1014 |
1012 |
-5.3 |
0.4 |
Brief sunny intervals all day |
|
|
3.1 |
9.7 |
6.6 |
78 |
90 |
84 |
0.5 |
6.3 |
3.4 |
18 |
3.2 |
1557 |
88.4 |
1002 |
1010 |
1006 |
1.0 |
107.5 |
|
|
|
Graphs for
November 2010 |
 |
|
Figure 1. Temperature and
Rainfall for November 2010. |
 |
|
Figure 2. Sunshine, air
pressure and mean wind speed for November 2010. |
 |
|
Figure 3.
Wind direction for November 2010. |
 |
|
Figure 4. Soil & sea
surface temperature (SST) for Lyme Bay for November 2010. Note
missing data from the 6th to the 23rd for soil temperatures. |
|