|
Summary for |
September
2010 |
|
Mean Max: |
19.2ºC |
(+0.7ºC) |
|
Mean Min: |
9.6ºC |
(-0.3ºC) |
|
Mean: |
14.4ºC |
(+0.2ºC) |
|
|
|
|
|
High Max: |
23.1ºC |
2nd |
|
Low Max: |
14.4ºC |
24th |
|
High Min: |
16.7ºC |
6th |
|
Low Min: |
0.2ºC |
26th |
|
Mean Grass Min: |
7.2ºC |
|
|
Grass Min: |
-1.7ºC |
26th |
|
|
|
|
|
Rain Total (gauge): |
63.4 mm |
|
|
Rain Total (tipping bucket): |
63.4 mm |
(155%) |
|
Rain Days >0.2 mm: |
10 Days |
|
|
Rain Days >1.0 mm: |
6 Days |
|
|
Max 24 hrs: |
32.8 mm |
23rd |
|
Days without any rain: |
20 |
|
|
|
|
|
|
Air Frost: |
0 Days |
|
|
Ground Frost: |
1 Days |
|
|
Snow Falling: |
0 Days |
|
|
Snow (50%) @ 9am: |
0 Days |
|
|
Thunder Heard: |
1 Days |
|
|
Hail <5 mm: |
0 Days |
|
|
Hail >5 mm: |
0 Days |
|
|
Fog @ 9am: |
0 Days |
|
|
|
|
|
|
Total Monthly Sunshine: |
192h:37m |
|
|
Total Monthly Sunshine: |
192.6 Hours |
|
|
Most Sunshine in a Day: |
12h:21m |
1st |
|
Average Daily Sunshine: |
06h:25m |
|
|
Sunless Days: |
1 Days |
|
|
Cloudless Days: |
14 Days |
|
|
Total Possible Sunshine: |
378h:41m |
|
|
Percentage of Total Sun: |
51% |
|
|
|
|
|
|
Mean Soil Temp @ 30 cm: |
14.2ºC |
|
|
Min Soil Temp @ 30 cm: |
12.3ºC |
26th |
|
Max Soil Temp @ 30 cm: |
15.4ºC |
6th |
|
Mean Soil Temp @ 100 cm: |
14.5ºC |
|
|
Min Soil Temp @ 100 cm: |
13.5ºC |
29th |
|
Max Soil Temp @ 100 cm: |
14.9ºC |
1st |
|
|
|
|
|
Mean 10 Min Wind >39 mph: |
0.00 Days |
|
|
N: |
1.92 Days |
|
|
NE: |
2.63 Days |
|
|
E: |
3.49 Days |
|
|
SE: |
5.05 Days |
|
|
S: |
3.27 Days |
|
|
SW: |
2.94 Days |
|
|
W: |
6.67 Days |
|
|
NW: |
4.04 Days |
|
|
Calm: |
1.00 Days |
|
|
Mean Wind: |
2.4 mph |
|
|
Max Gust: |
29 mph |
6th |
|
|
|
|
|
Mean Cloud Cover: |
58% |
|
|
Mean RH @ 9am: |
90% |
|
|
Rain Duration >0.1mm/hour: |
22.5 Hours |
|
|
Frost Duration: |
0.0 Hours |
|
|
Max Frost Duration in a Day: |
0.0 Hours |
|
|
|
|
|
|
Mean Sea Temperature: |
17.0ºC |
|
|
Normal for Month: |
|
|
|
Max Sea Temperature: |
17.7ºC |
12th |
|
Min Sea Temperature: |
16.2ºC |
30th |
|
|
|
|
|
Mean Pressure @ 9am: |
1015.4 hPa |
(-1.9 hPa) |
|
Mean Pressure: |
1015.3 hPa |
(-2.0 hPa) |
|
Max Pressure: |
1028.6 hPa |
13th |
|
Min Pressure: |
998.5 hPa |
7th |
|
|
|
|
|
Max Dewpoint: |
16.1ºC |
10th |
|
Min Dewpoint: |
-2.2ºC |
26th |
|
Mean Dewpoint: |
9.6ºC |
|
|
|
|
|
|
Max Humidity: |
92% |
2nd |
|
Min Humidity: |
47% |
17th |
|
Mean Humidity: |
77% |
(+1) |
|
|
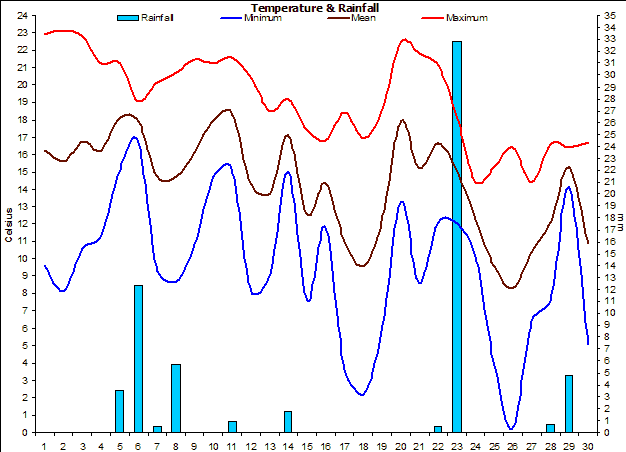
A
generally settled, warm and quite sunny month.
Temperatures were
above normal by day but due to a run of cold nights at
the end of the month, the average minimum temperatures
ended up below average. |
|
There was one very wet day
on the 23rd when 32.8 mm of rain fell. |
|
There was
an unusual (for September) grass frost on the 26th. |
|
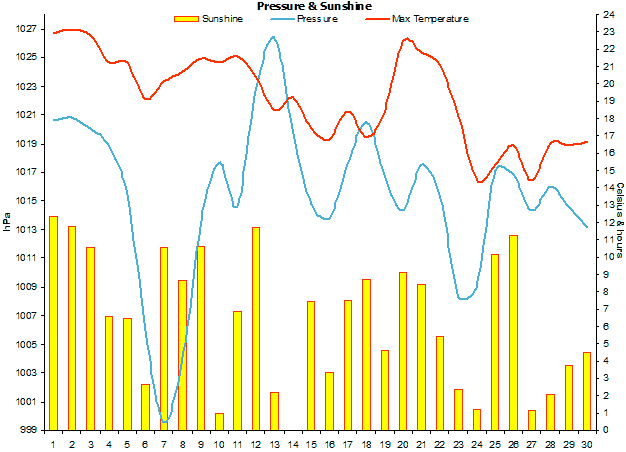
Sunshine
amounts were slightly above normal with the last week
being particularly sunny. |
|
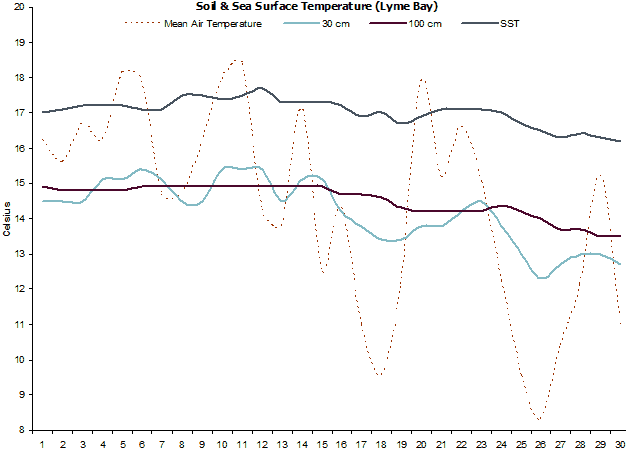
Soil temperatures were
around normal through most of the month but ended up
rather below average due to a few cold nights at the end
of the month. |
|
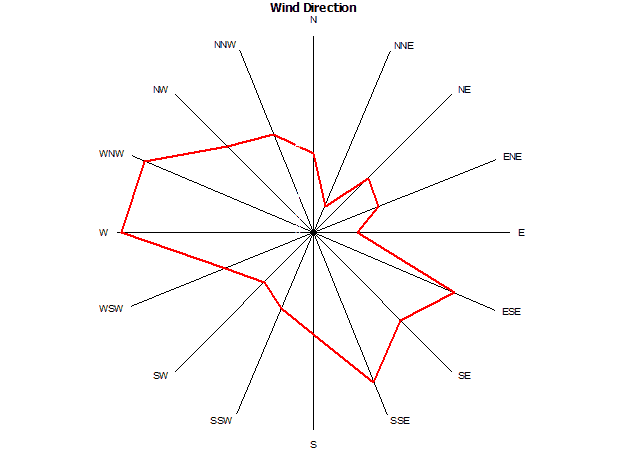
Winds were dominant from
the west sectors, though there were frequent sea breezes
from the SSE. |
|
Rainfall duration was just
22.5 hours. |
|
Sea temperatures fell
slightly throughout the month, mainly due to run of
quite cool nights. |
|
Mean pressure was below
average. |
|
Dewpoints were below
average. |
|
The RH ended up being
slightly above normal. |
|
|
|
Weather Data for Otter Valley, Devon. |
September 2010 |
|
|
|
Temp (oC) |
Hum (RH%) |
Dewpoint (oC) |
Wind (mph) |
Rain |
Pressure (hPa) |
Grass |
Sun |
|
|
|
Min |
Max |
Ave |
Min |
Max |
Ave |
Min |
Max |
Ave |
Max |
Ave |
Run |
mm |
Min |
Max |
Ave |
Min |
Hours |
Observations |
|
1 |
9.6 |
22.9 |
16.3 |
54 |
91 |
73 |
7.0 |
13.7 |
10.4 |
13 |
1.5 |
0 |
0.0 |
1019 |
1023 |
1021 |
7.1 |
12.4 |
Sunny all day |
|
2 |
8.1 |
23.1 |
15.6 |
55 |
92 |
74 |
5.4 |
14.1 |
9.8 |
12 |
1.4 |
0 |
0.0 |
1019 |
1023 |
1021 |
5.5 |
11.8 |
Sunny all day |
|
3 |
10.6 |
22.8 |
16.7 |
56 |
92 |
74 |
7.1 |
14.3 |
10.7 |
14 |
1.7 |
0 |
0.0 |
1019 |
1021 |
1020 |
7.3 |
10.5 |
Sunny all day |
|
4 |
11.3 |
21.2 |
16.3 |
61 |
91 |
76 |
8.1 |
15.1 |
11.6 |
17 |
1.8 |
0 |
0.0 |
1018 |
1020 |
1019 |
10.4 |
6.6 |
Sunny ints all day |
|
5 |
15.1 |
21.2 |
18.2 |
66 |
90 |
78 |
9.6 |
15.4 |
12.5 |
21 |
5.2 |
0 |
3.5 |
1012 |
1019 |
1015 |
13.7 |
6.4 |
|
|
6 |
16.7 |
19.1 |
17.9 |
72 |
91 |
82 |
12.0 |
14.6 |
13.3 |
29 |
8.1 |
0 |
12.3 |
1000 |
1013 |
1006 |
7.7 |
2.6 |
|
|
7 |
9.3 |
20.1 |
14.7 |
64 |
92 |
78 |
7.3 |
13.7 |
10.5 |
19 |
2.3 |
0 |
0.4 |
999 |
1001 |
1000 |
7.7 |
10.6 |
Sunny all day |
|
8 |
8.7 |
20.7 |
14.7 |
66 |
92 |
79 |
6.7 |
14.7 |
10.7 |
10 |
0.5 |
0 |
5.7 |
1001 |
1007 |
1004 |
8.4 |
8.6 |
Sunny ints all day |
|
9 |
10.8 |
21.5 |
16.2 |
56 |
92 |
74 |
8.8 |
14.1 |
11.5 |
17 |
2.0 |
0 |
0.0 |
1008 |
1019 |
1014 |
8.4 |
10.6 |
Sunny all day |
|
10 |
14.7 |
21.2 |
18.0 |
73 |
89 |
81 |
9.7 |
16.1 |
12.9 |
22 |
2.8 |
0 |
0.0 |
1016 |
1020 |
1018 |
14.5 |
1.0 |
|
|
11 |
15.2 |
21.6 |
18.4 |
59 |
91 |
75 |
11.1 |
14.9 |
13.0 |
22 |
3.4 |
0 |
0.9 |
1012 |
1017 |
1015 |
5.5 |
6.8 |
|
|
12 |
8.1 |
20.4 |
14.3 |
53 |
92 |
73 |
5.8 |
11.9 |
8.9 |
18 |
3.0 |
0 |
0.0 |
1018 |
1028 |
1023 |
5.2 |
11.7 |
Sunny all day |
|
13 |
9.1 |
18.5 |
13.8 |
69 |
90 |
80 |
5.9 |
13.1 |
9.5 |
16 |
1.3 |
0 |
0.0 |
1024 |
1029 |
1026 |
13.9 |
2.2 |
Sunny ints am, cloudy pm |
|
14 |
15.0 |
19.2 |
17.1 |
78 |
89 |
84 |
11.4 |
15.7 |
13.6 |
25 |
4.4 |
0 |
1.8 |
1015 |
1024 |
1020 |
10.7 |
0.0 |
Cloudy all day |
|
15 |
7.6 |
17.4 |
12.5 |
55 |
91 |
73 |
4.8 |
11.0 |
7.9 |
27 |
4.3 |
0 |
0.0 |
1013 |
1017 |
1015 |
6.7 |
7.4 |
Sunny intervals all day |
|
16 |
11.8 |
16.8 |
14.3 |
63 |
87 |
75 |
7.0 |
10.7 |
8.9 |
17 |
3.9 |
0 |
0.0 |
1013 |
1015 |
1014 |
2.8 |
3.3 |
Sunny intervals all day |
|
17 |
3.6 |
18.4 |
11.0 |
47 |
91 |
69 |
1.3 |
10.0 |
5.7 |
19 |
2.2 |
0 |
0.0 |
1015 |
1020 |
1018 |
1.5 |
7.5 |
Sunny intervals all day |
|
18 |
2.2 |
16.9 |
9.6 |
59 |
91 |
75 |
-0.5 |
9.5 |
4.5 |
0 |
0.4 |
0 |
0.0 |
1019 |
1022 |
1021 |
0.4 |
8.7 |
Sunny intervals all day |
|
19 |
5.8 |
18.5 |
12.2 |
69 |
91 |
80 |
3.2 |
12.5 |
7.9 |
20 |
2.2 |
0 |
0.0 |
1014 |
1020 |
1017 |
12.3 |
4.6 |
Sunny ints am, cloudy pm |
|
20 |
13.3 |
22.5 |
17.9 |
53 |
89 |
71 |
9.9 |
13.1 |
11.5 |
10 |
1.4 |
0 |
0.0 |
1012 |
1016 |
1014 |
7.6 |
9.1 |
Sunny intervals all day |
|
21 |
8.6 |
21.8 |
15.2 |
62 |
92 |
77 |
6.0 |
14.7 |
10.4 |
13 |
1.6 |
0 |
0.0 |
1016 |
1019 |
1018 |
8.6 |
8.4 |
Sunny intervals all day |
|
22 |
12.1 |
21.1 |
16.6 |
68 |
92 |
80 |
9.7 |
15.1 |
12.4 |
15 |
1.4 |
0 |
0.4 |
1013 |
1018 |
1015 |
12.2 |
5.4 |
Sunny am, cloudy pm |
|
23 |
12.0 |
18.1 |
15.1 |
72 |
92 |
82 |
9.8 |
14.3 |
12.1 |
12 |
1.0 |
0 |
32.8 |
1004 |
1013 |
1008 |
6.7 |
2.4 |
Sunny intervals all day |
|
24 |
10.1 |
14.4 |
12.3 |
72 |
92 |
82 |
6.4 |
11.0 |
8.7 |
20 |
3.2 |
0 |
0.0 |
1003 |
1015 |
1009 |
1.6 |
1.2 |
Sunny ints am, cloudy pm |
|
25 |
3.8 |
15.3 |
9.6 |
55 |
89 |
72 |
1.4 |
7.0 |
4.2 |
20 |
2.0 |
0 |
0.0 |
1015 |
1019 |
1017 |
-1.7 |
10.2 |
Sunny intervals all day |
|
26 |
0.2 |
16.4 |
8.3 |
50 |
91 |
71 |
-2.2 |
6.5 |
2.2 |
17 |
2.3 |
0 |
0.0 |
1015 |
1019 |
1017 |
5.5 |
11.3 |
Sunny all day |
|
27 |
6.4 |
14.4 |
10.4 |
75 |
89 |
82 |
3.5 |
10.4 |
7.0 |
15 |
1.1 |
0 |
0.0 |
1013 |
1015 |
1014 |
5.7 |
1.2 |
Brief sunny intervals all day |
|
28 |
7.7 |
16.6 |
12.2 |
74 |
91 |
83 |
5.2 |
13.2 |
9.2 |
15 |
1.4 |
0 |
0.7 |
1015 |
1017 |
1016 |
4.8 |
2.1 |
Sunny am, cloudy pm |
|
29 |
14.1 |
16.4 |
15.3 |
67 |
92 |
80 |
6.4 |
13.2 |
9.8 |
20 |
4.6 |
0 |
4.8 |
1013 |
1016 |
1015 |
3.5 |
3.7 |
Rain am, sunny intervals pm |
|
30 |
5.1 |
16.7 |
10.9 |
76 |
92 |
84 |
2.9 |
12.9 |
7.9 |
0 |
0.1 |
0 |
0.0 |
1010 |
1017 |
1013 |
12.7 |
4.5 |
Sunny am, cloudy pm |
|
|
9.6 |
19.2 |
14.4 |
63 |
91 |
77 |
6.4 |
12.9 |
9.6 |
18 |
2.4 |
0 |
63.4 |
1013 |
1018 |
1015 |
7.2 |
192.6 |
|
|
|
Graphs for
September 2010 |
 |
|
Figure 1. Temperature and
Rainfall for September 2010. |
 |
|
Figure 2. Sunshine, air
pressure and mean wind speed for September 2010. |
 |
|
Figure 3.
Wind direction for September 2010. |
 |
|
Figure 4. Soil & sea
surface temperature (SST) for Lyme Bay for September 2010. |