|
April 2012 |
|
Thurlestone Rock, South Devon. |
|
Summary for |
April
2012 |
|
Mean Max: |
12.7ºC |
(-0.0ºC) |
|
Mean Min: |
3.5ºC |
(-0.9ºC) |
|
Mean: |
8.1ºC |
(-0.4ºC) |
|
|
|
|
|
High Max: |
15.9ºC |
8th |
|
Low Max: |
8.0ºC |
4th |
|
High Min: |
9.7ºC |
9th |
|
Low Min: |
-1.5ºC |
16th |
|
Mean Grass Min: |
2.2ºC |
|
|
Grass Min: |
-2.4ºC |
6th |
|
|
|
|
|
Rain Total (gauge): |
128.0 mm |
(285%) |
|
Rain Total (tipping bucket): |
127.2 mm |
(283%) |
|
Rain Days >0.2 mm: |
18 Days |
|
|
Rain Days >1.0 mm: |
16 Days |
|
|
Max 24 hrs: |
26.0 mm |
25th |
|
Days without any rain: |
12 |
|
|
|
|
|
|
Air Frost: |
3 Days |
|
|
Ground Frost: |
8 Days |
|
|
Snow Falling: |
0 Days |
|
|
Snow (50%) @ 9am: |
0 Days |
|
|
Thunder Heard: |
2 Days |
|
|
Hail <5 mm: |
4 Days |
|
|
Hail >5 mm: |
0 Days |
|
|
Fog @ 9am: |
0 Days |
|
|
|
|
|
|
Total Monthly Sunshine: |
146.8 Hours |
(76%) |
|
Most Sunshine in a Day: |
12.3 Hours |
1st |
|
Average Daily Sunshine: |
4.9 Hours |
|
|
Sunless Days: |
3 Days |
|
|
Cloudless Days: |
2 Days |
|
|
Total Possible Sunshine: |
415.9 Hours |
|
|
Percentage of Total Sun: |
35% |
|
|
Maximum UV Index: |
5.7 |
24th |
|
Time of Max UV |
|
13:45 |
|
|
|
|
|
Mean Soil Temp @ 30 cm: |
N/A |
|
|
Min Soil Temp @ 30 cm: |
N/A |
|
|
Max Soil Temp @ 30 cm: |
N/A |
|
|
Mean Soil Temp @ 100 cm: |
N/A |
|
|
Min Soil Temp @ 100 cm: |
N/A |
|
|
Max Soil Temp @ 100 cm: |
N/A |
|
|
|
|
|
|
Mean 10 Min Wind >39 mph: |
0.00 Days |
|
|
N: |
9.81 Days |
|
|
NE: |
1.62 Days |
|
|
E: |
1.71 Days |
|
|
SE: |
2.06 Days |
|
|
S: |
4.77 Days |
|
|
SW: |
2.92 Days |
|
|
W: |
0.98 Days |
|
|
NW: |
5.54 Days |
|
|
Calm: |
0.59 Days |
|
|
Wind Chill Low: |
-3.1ºC |
16th |
|
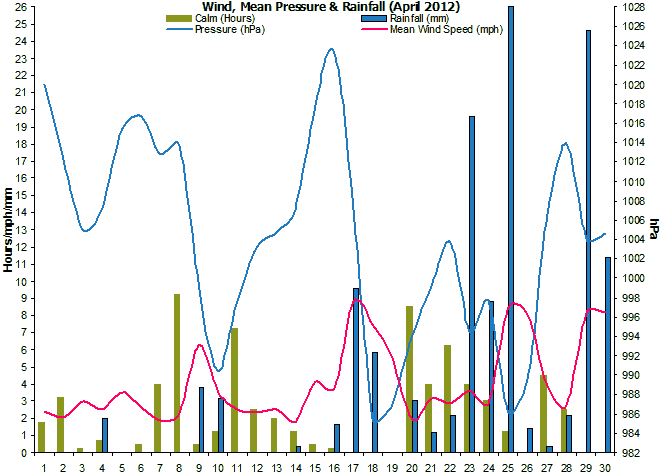
Mean Wind: |
4.1 mph |
|
|
Max Gust: |
38 mph |
30th |
|
|
30.00 Days |
|
|
Mean Cloud Cover: |
65% |
|
|
Mean RH @ 9am: |
92% |
|
|
Rain Duration >0.1mm/hour: |
73.0 Hours |
|
|
Frost Duration: |
18.0 Hours |
|
|
Max Frost Duration in a Day: |
7.3 Hours |
16th |
|
|
|
|
|
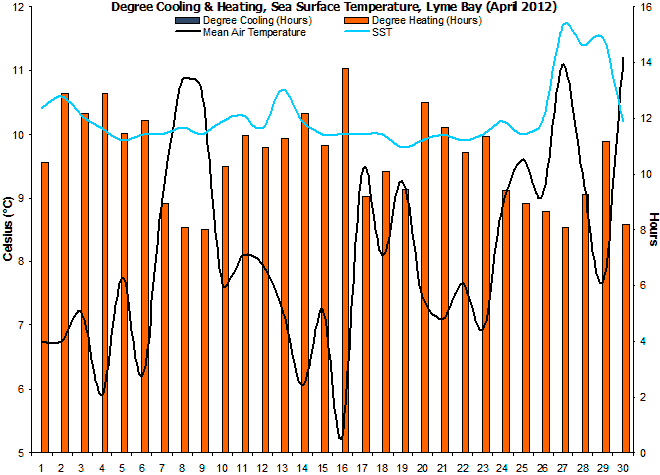
Mean Sea Temperature: |
10.3ºC |
(-0.1ºC) |
|
Normal for Month: |
10.4ºC |
|
|
Max Sea Temperature: |
11.7ºC |
27th |
|
Min Sea Temperature: |
9.8ºC |
19th |
|
|
|
|
|
Mean Pressure @ 9am: |
1003.6 hPa |
(-12.6 hPa) |
|
Mean Pressure: |
1004.0 hPa |
(-12.2 hPa) |
|
Max Pressure: |
1027.0 hPa |
16th |
|
Min Pressure: |
974.5 hPa |
25th |
|
|
|
|
|
Radiation Daily Mean |
13.07 MJ/m² |
|
|
Max Daily Value |
22.64 MJ/m² |
15th |
|
Min Daily Value |
3.00 MJ/m² |
29th |
|
Number of Days with Data |
30 Days |
|
|
1-Hour Maximum |
1097 W/m² |
27th |
|
Starting Time of the Hour |
|
12:00 |
|
|
|
|
|
Max Dewpoint: |
11.4ºC |
27th |
|
Min Dewpoint: |
-3.1ºC |
16th |
|
Mean Dewpoint: |
4.9ºC |
|
|
|
|
|
|
Max Humidity: |
98% |
2nd |
|
Min Humidity: |
40% |
15th |
|
Mean Humidity: |
80% |
(+2) |
|
|
A cool, wet month.
This
April has broken a trend towards ever drier and warmer
Aprils that started in 2007.
There
were no warm days (temperature >16.0°C), but no really
cold ones either with the last air frost occurring on
the 16th. |
|
Rainfall was well above
the average, with this month ending up the wettest April
since before 2005. There were two particularly wet days
on the 26th and the 29th. |
|
There
were 3 air frosts, all of which were slight, and
there were 8 ground frosts. As usual for April, no snow
was seen falling. A very showery month with two
thunderstorms and hail falling on 4 days. |
|
As can be
expected from it being a very wet month, sunshine levels
were rather below average and there were only two days
of unbroken sunshine. |
|
No soil temperature
readings were taken due to relocation of sensors. |
|
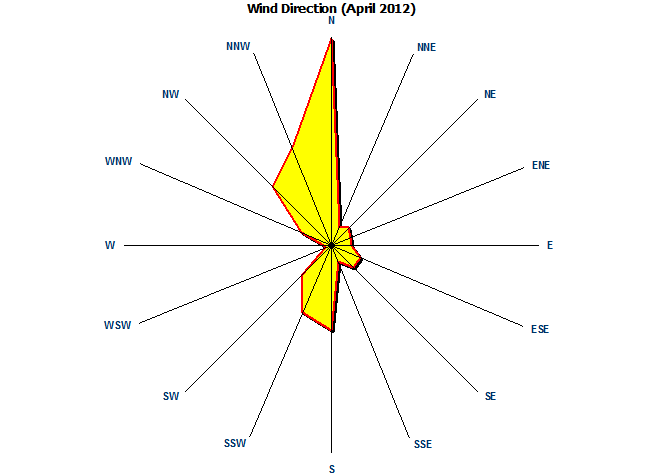
The dominant wind direction was
northerly though southerly winds also dominated, due to
frequent sea breezes. On the whole this was a breezy
month. A maximum gust of 38 mph on the 30th is rather
high for April, especially so late in the month, and
caused trees to be damaged as they were in full leaf by
then. |
|
Rainfall duration of 73
hours shows just how wet this month was, and with 65%
cloud-cover, this was also a cloudy month. |
|
Sea surface temperatures
actually fell slowly through the month until the 19th,
then started to rise. |
|
Mean pressure was well
below the average for April and indicative of the unsettled nature
of this month. |
|
A new sensor has been
added that measures solar irradiance in watts per square
metre falling on a horizontal surface. |
|
Dewpoints were often below
the average due to cold, dry northerly airstreams. |
|
Despite the lower than
average dewpoints, the relative humidity was
slightly above normal. |
|
|
|
Weather Data for Otter Valley, Devon. |
April 2012 |
|
|
|
Temp (oC) |
Hum (RH%) |
Dewpoint (oC) |
Wind (mph) |
Rain |
Pressure (hPa) |
Grass |
Sun |
|
|
|
Min |
Max |
Ave |
Min |
Max |
Ave |
Min |
Max |
Ave |
Max |
Ave |
Run |
mm |
Min |
Max |
Ave |
Min |
Hours |
Observations |
|
1 |
1.1 |
12.4 |
6.8 |
51 |
93 |
72 |
-1.1 |
6.2 |
2.6 |
14 |
2.4 |
58 |
0.0 |
1017 |
1023 |
1020 |
-0.9 |
12.3 |
Sunny all day |
|
2 |
-1.3 |
14.8 |
6.8 |
51 |
98 |
75 |
-2.4 |
7.0 |
2.3 |
12 |
2.1 |
49 |
0.0 |
1007 |
1017 |
1012 |
-1.5 |
11.3 |
Sunny all day |
|
3 |
0.3 |
14.1 |
7.2 |
56 |
98 |
77 |
-1.2 |
8.4 |
3.6 |
15 |
3.0 |
71 |
0.0 |
1003 |
1007 |
1005 |
-1.0 |
2.2 |
Sunny intervals all day |
|
4 |
3.8 |
8.0 |
5.9 |
70 |
91 |
81 |
1.5 |
4.4 |
3.0 |
17 |
2.5 |
61 |
2.0 |
1003 |
1011 |
1007 |
1.7 |
1.6 |
Sunny ints, showers pm |
|
5 |
5.3 |
10.2 |
7.8 |
74 |
92 |
83 |
3.5 |
6.8 |
5.2 |
17 |
3.5 |
85 |
0.0 |
1012 |
1019 |
1015 |
3.6 |
0.3 |
Cloudy am, sunny ints pm |
|
6 |
-1.3 |
13.7 |
6.2 |
47 |
96 |
72 |
-2.7 |
5.4 |
1.4 |
14 |
2.6 |
63 |
0.0 |
1013 |
1020 |
1017 |
-2.4 |
7.9 |
Sunny am, cloudy pm |
|
7 |
4.1 |
13.9 |
9.0 |
69 |
96 |
83 |
2.0 |
9.1 |
5.6 |
11 |
1.9 |
46 |
0.0 |
1011 |
1015 |
1013 |
3.4 |
0.1 |
Sunny ints am, cloudy pm |
|
8 |
5.8 |
15.9 |
10.9 |
66 |
96 |
81 |
3.8 |
11.0 |
7.4 |
17 |
2.3 |
55 |
0.0 |
1011 |
1017 |
1014 |
6.6 |
1.6 |
Sunny intervals all day |
|
9 |
9.7 |
11.7 |
10.7 |
78 |
95 |
87 |
6.6 |
10.0 |
8.3 |
26 |
6.3 |
152 |
3.8 |
987 |
1011 |
999 |
8.3 |
0.0 |
Rain, intermittent all day |
|
10 |
2.7 |
12.6 |
7.7 |
56 |
97 |
77 |
1.3 |
9.4 |
5.4 |
16 |
3.5 |
85 |
3.2 |
987 |
994 |
990 |
0.4 |
8.8 |
Sunny am, showers pm |
|
11 |
1.4 |
14.8 |
8.1 |
46 |
98 |
72 |
0.3 |
6.4 |
3.4 |
14 |
2.5 |
60 |
0.0 |
994 |
1001 |
998 |
0.5 |
11.1 |
Sunny ints am, sunny pm |
|
12 |
1.3 |
14.6 |
8.0 |
52 |
98 |
75 |
0.0 |
7.8 |
3.9 |
14 |
2.3 |
56 |
0.0 |
1002 |
1005 |
1003 |
0.2 |
5.3 |
Sunny intervals all day |
|
13 |
0.3 |
14.2 |
7.3 |
58 |
98 |
78 |
-1.1 |
7.6 |
3.3 |
16 |
2.5 |
61 |
0.0 |
1004 |
1006 |
1005 |
-0.4 |
11.8 |
Sunny intervals all day |
|
14 |
1.3 |
10.8 |
6.1 |
68 |
98 |
83 |
0.2 |
6.9 |
3.6 |
12 |
1.9 |
45 |
0.4 |
1004 |
1011 |
1007 |
0.2 |
1.8 |
Sun and showers all day |
|
15 |
1.7 |
12.8 |
7.3 |
40 |
91 |
66 |
-0.6 |
3.6 |
1.5 |
18 |
4.2 |
100 |
0.0 |
1011 |
1025 |
1018 |
0.4 |
10.0 |
Sunny intervals all day |
|
16 |
-1.5 |
12.0 |
5.3 |
61 |
96 |
79 |
-3.1 |
5.6 |
1.3 |
20 |
3.7 |
90 |
1.6 |
1019 |
1027 |
1023 |
3.1 |
7.5 |
Sun and showers all day |
|
17 |
6.2 |
12.6 |
9.4 |
60 |
96 |
78 |
3.4 |
9.0 |
6.2 |
36 |
8.8 |
211 |
9.6 |
995 |
1019 |
1007 |
2.8 |
5.9 |
Sun and showers all day |
|
18 |
5.6 |
10.6 |
8.1 |
76 |
94 |
85 |
3.3 |
7.9 |
5.6 |
33 |
7.5 |
179 |
5.8 |
976 |
995 |
986 |
4.6 |
0.9 |
Sun and showers all day |
|
19 |
7.1 |
11.4 |
9.3 |
68 |
88 |
78 |
4.7 |
7.4 |
6.1 |
21 |
5.6 |
134 |
0.0 |
982 |
992 |
987 |
4.6 |
5.1 |
Sunny intervals all day |
|
20 |
1.5 |
13.4 |
7.5 |
63 |
98 |
81 |
0.3 |
7.0 |
3.7 |
19 |
2.0 |
51 |
3.0 |
992 |
996 |
994 |
-0.3 |
5.2 |
Sun and showers all day |
|
21 |
0.6 |
13.6 |
7.1 |
54 |
98 |
76 |
-0.5 |
7.3 |
3.4 |
22 |
3.1 |
75 |
1.2 |
995 |
1004 |
999 |
-1.7 |
10.4 |
Sunny intervals all day |
|
22 |
2.3 |
13.0 |
7.7 |
73 |
98 |
86 |
1.1 |
9.2 |
5.2 |
20 |
2.9 |
69 |
2.2 |
1003 |
1005 |
1004 |
1.3 |
4.8 |
Sun and showers all day |
|
23 |
3.6 |
10.3 |
7.0 |
84 |
97 |
91 |
2.0 |
9.1 |
5.6 |
22 |
3.7 |
88 |
19.6 |
985 |
1004 |
995 |
2.3 |
0.1 |
Rain am, showers pm |
|
24 |
3.1 |
14.6 |
8.9 |
58 |
98 |
78 |
2.1 |
8.1 |
5.1 |
17 |
2.9 |
64 |
8.8 |
994 |
1001 |
998 |
1.6 |
6.1 |
Sun and showers all day |
|
25 |
7.1 |
12.1 |
9.6 |
79 |
97 |
88 |
5.5 |
9.9 |
7.7 |
32 |
8.5 |
201 |
26.0 |
975 |
998 |
986 |
6.6 |
1.8 |
Sunny ints am, then rain |
|
26 |
5.1 |
13.0 |
9.1 |
73 |
98 |
86 |
4.1 |
9.4 |
6.8 |
26 |
8.1 |
194 |
1.4 |
978 |
1001 |
990 |
3.4 |
2.0 |
Sun and showers all day |
|
27 |
7.0 |
15.2 |
11.1 |
72 |
97 |
85 |
5.2 |
11.4 |
8.3 |
21 |
3.9 |
94 |
0.4 |
1001 |
1012 |
1007 |
5.0 |
7.4 |
Sunny intervals all day |
|
28 |
7.9 |
10.7 |
9.3 |
83 |
96 |
90 |
6.0 |
9.1 |
7.6 |
20 |
2.7 |
66 |
2.2 |
1012 |
1016 |
1014 |
7.7 |
0.0 |
Cloudy all day |
|
29 |
5.3 |
10.1 |
7.7 |
79 |
97 |
88 |
3.6 |
9.5 |
6.6 |
33 |
8.1 |
195 |
24.6 |
995 |
1013 |
1004 |
4.9 |
0.0 |
Rain all day |
|
30 |
8.1 |
14.3 |
11.2 |
71 |
94 |
83 |
6.7 |
10.1 |
8.4 |
38 |
8.2 |
196 |
11.4 |
997 |
1012 |
1005 |
7.8 |
3.5 |
Rain am, sunny ints pm |
|
|
3.5 |
12.7 |
8.1 |
65 |
96 |
80 |
1.9 |
8.0 |
4.9 |
20 |
4.1 |
2954 |
127.2 |
999 |
1009 |
1004 |
2.4 |
146.8 |
|
Graphs for
April 2012 |
 |
|
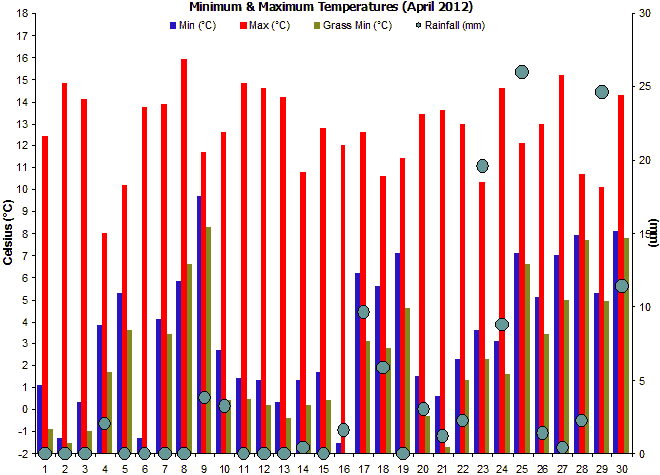
Figure 1. Temperature and
Rainfall for April 2012. |
 |
|
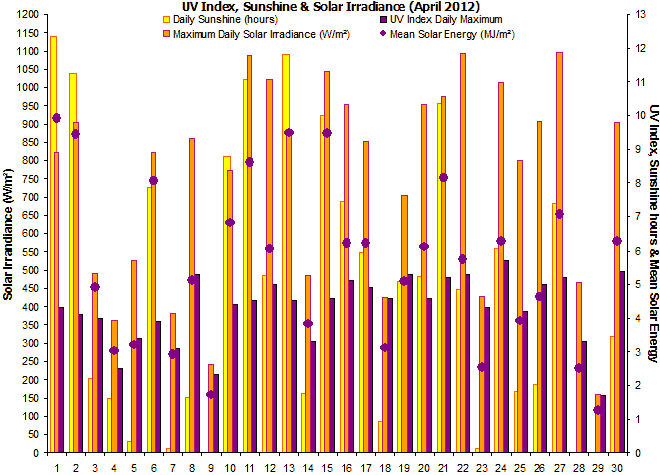
Figure 2. Sunshine, UV
Index and solar irradiance for April 2012. |
 |
|
Figure 3.
Wind direction for April 2012. |
 |
|
Figure 4. Sea surface
temperature & cooling/heating days for April 2012. |
 |
|
Figure 5.
Mean wind speed, calm hours and air pressure for April 2012. |
|