|
August 2012 |
|
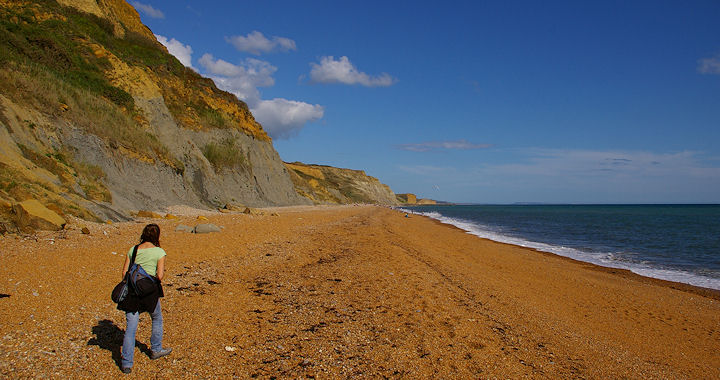
Over the border and a visit to the Jurassic Coast
of west Dorset.
A walk along the beach near Thorncombe Beacon on a
hot and sunny August day. |
|
Summary for |
August
2012 |
|
Mean Max: |
20.8ºC |
(-0.4ºC) |
|
Mean Min: |
13.8ºC |
(+1.8ºC) |
|
Mean: |
17.3ºC |
(+0.7ºC) |
|
|
|
|
|
High Max: |
26.4ºC |
19th |
|
Low Max: |
17.2ºC |
24th |
|
High Min: |
18.6ºC |
15th |
|
Low Min: |
6.1ºC |
31st |
|
Mean Grass Min: |
11.7ºC |
|
|
Grass Min: |
4.0ºC |
31st |
|
|
|
|
|
Rain Total (gauge): |
112.6 mm |
(234%) |
|
Rain Total (tipping bucket): |
101.6 mm |
(198%) |
|
Rain Days >0.2 mm: |
18 Days |
|
|
Rain Days >1.0 mm: |
15 Days |
|
|
Max 24 hrs: |
21.0 mm |
15th |
|
Days without any rain: |
13 |
|
|
|
|
|
|
Air Frost: |
0 Days |
|
|
Grass Frost: |
0 Days |
|
|
Snow Falling: |
0 Days |
|
|
Snow (50%) @ 9am: |
0 Days |
|
|
Ice Days: |
0 Days |
|
|
Thunder Heard: |
4 Days |
|
|
Hail <5 mm: |
0 Days |
|
|
Hail >5 mm: |
0 Days |
|
|
Fog @ 9am: |
2 Days |
|
|
|
|
|
|
Total Monthly Sunshine: |
167.4 Hours |
(72%) |
|
Most Sunshine in a Day: |
14.0 Hours |
10th |
|
Average Daily Sunshine: |
5.4 Hours |
|
|
Sunless Days: |
0 Days |
|
|
Cloudless Days: |
1 Day |
|
|
Total Possible Sunshine: |
448 Hours |
|
|
Percentage of Total Sun: |
37% |
|
|
Maximum UV Index: |
8.5 |
18th |
|
Time of Max UV: |
|
13:15 |
|
|
|
|
|
Mean Soil Temp @ 30 cm: |
N/A |
|
|
Min Soil Temp @ 30 cm: |
N/A |
|
|
Max Soil Temp @ 30 cm: |
N/A |
|
|
Mean Soil Temp @ 100 cm: |
N/A |
|
|
Min Soil Temp @ 100 cm: |
N/A |
|
|
Max Soil Temp @ 100 cm: |
N/A |
|
|
|
|
|
|
Mean 10 Min Wind >39 mph: |
0.00 Days |
|
|
N: |
2.01 Days |
|
|
NE: |
0.11 Days |
|
|
E: |
2.24 Days |
|
|
SE: |
2.17 Days |
|
|
S: |
14.99 Days |
|
|
SW: |
3.04 Days |
|
|
W: |
0.55 Days |
|
|
NW: |
1.97 Days |
|
|
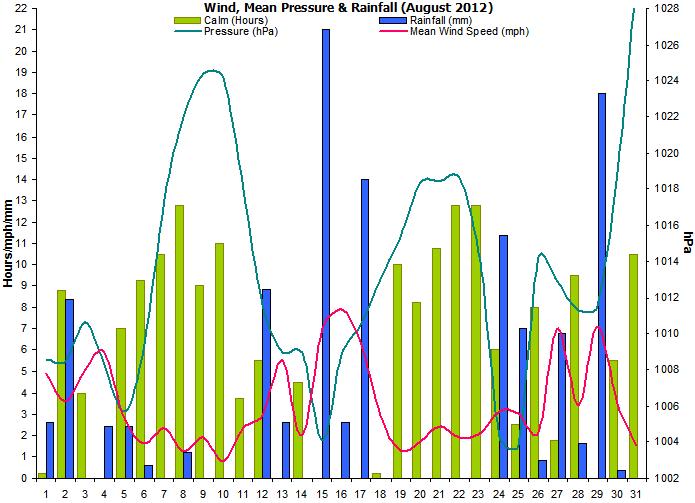
Calm: |
3.92 Days |
|
|
Wind Chill Low: |
5.3ºC |
31st |
|
Mean Wind: |
3.5 mph |
|
|
Max Gust: |
35 mph |
15th |
|
|
31.00 Days |
|
|
Mean Cloud Cover: |
58% |
|
|
Mean RH @ 9am: |
95% |
|
|
Rain Duration >0.1mm/hour: |
46.3 Hours |
|
|
Frost Duration: |
0.0 Hours |
|
|
Max Frost Duration in a Day: |
0.0 Hours |
1st |
|
|
|
|
|
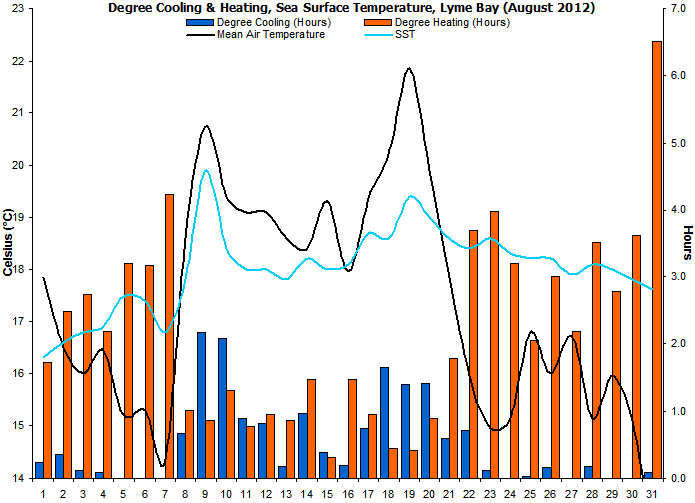
Mean Sea Temperature: |
18.0ºC |
(+0.6ºC) |
|
Normal for Month: |
17.4ºC |
|
|
Max Sea Temperature: |
19.9ºC |
9th |
|
Min Sea Temperature: |
16.3ºC |
1st |
|
|
|
|
|
Mean Pressure @ 9am: |
1013.4 hPa |
(-3.9 hPa) |
|
Mean Pressure: |
1013.4 hPa |
(-3.9 hPa) |
|
Max Pressure: |
1031.8 hPa |
30th |
|
Min Pressure: |
998.2 hPa |
25th |
|
|
|
|
|
Radiation Daily Mean: |
11.6 MJ/m² |
|
|
Max Daily Value: |
21.5 MJ/m² |
10th |
|
Min Daily Value: |
3.7 MJ/m² |
24th |
|
Number of Days with Data: |
31 Days |
|
|
1-Hour Maximum: |
957 W/m² |
2nd |
|
Starting Time of the Hour: |
|
#N/A |
|
|
|
|
|
Max Dewpoint: |
20.5ºC |
19th |
|
Min Dewpoint: |
4.4ºC |
31st |
|
Mean Dewpoint: |
14.5ºC |
|
|
|
|
|
|
Max Humidity: |
99% |
28th |
|
Min Humidity: |
52% |
31st |
|
Mean Humidity: |
85% |
(+7) |
|
|
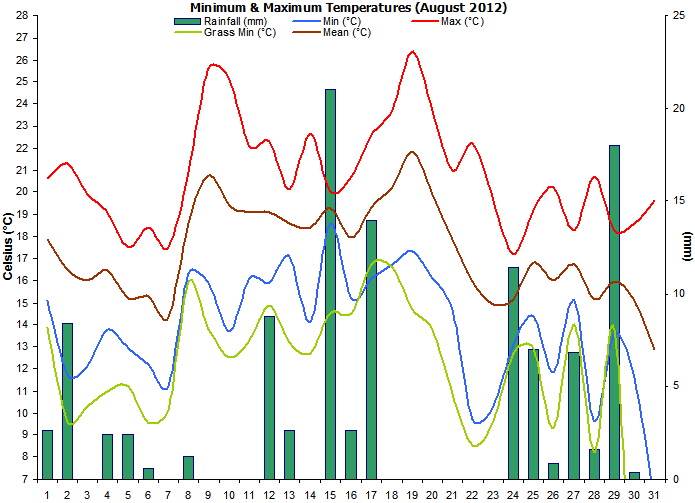
A generally
warm but wet month with below average levels of
sunshine.
A cool
start and end to this August but warm from the 9th to
the 22nd with plenty of sunshine, but also quite a lot
of rain too. There were a few very warm nights
mid-month, and the humidity was high making it feeling
quite oppressive at times. |
|
Rainfall was liberally
spread throughout the month with the only 'lengthy' dry period
being from the 18th to the 23rd. As with June and July,
rainfall amounts were extremely high leading to the
wettest summer recorded at this station. |
|
As
expected in a summer month, there
were no air frosts or grass frosts. Thunder was
heard on 4 occasions, which is rather typical for
August. It was also foggy on two days due to regular
influxes of tropical maritime air causing sea fog. |
|
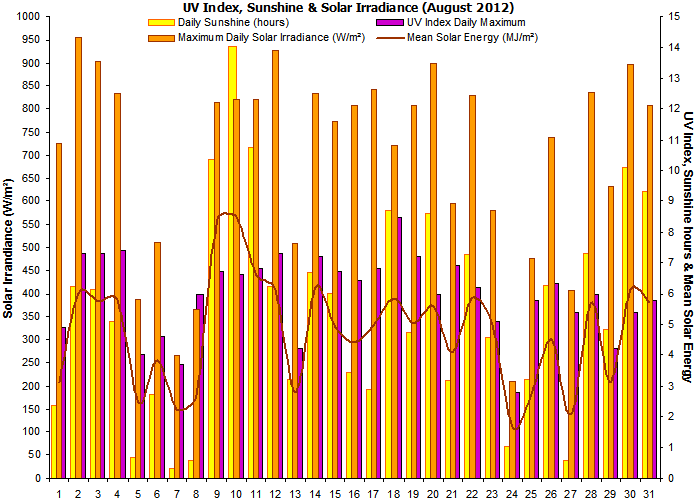
As with
June and July, sunshine amounts were disappointing, but
the low figure of 167 hours was not as bad as it
appears. This was because the mornings were often cloudy
but the sun broke through the cloud by midday, and the
afternoons were generally quite sunny. This gave the
impression of a month that was sunnier than the actual
data suggests. |
|
No soil temperature
readings were taken due to relocation of sensors. These
are planned to be installed in August 2012 and readings
will commence at the beginning of September 2012. |
|
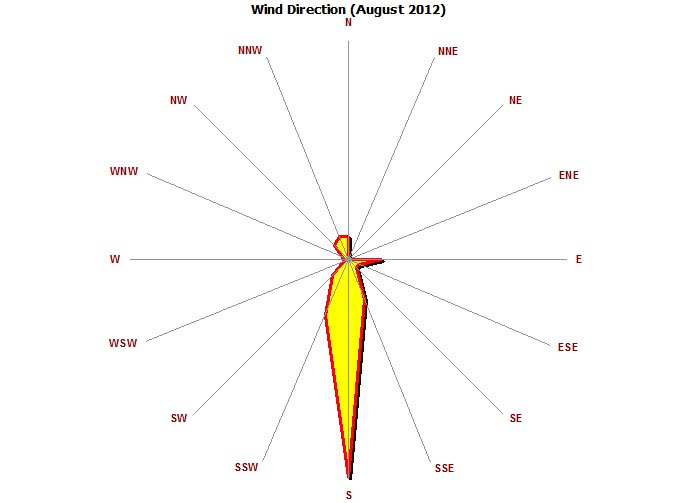
The dominant wind direction was
overwhelmingly from a southerly direction. This was due to
frequent sea breezes and typical for a summer month at
this location near the sea. |
|
Rainfall duration was 48
hours, and representative of the wetter than normal nature of this
month. |
|
Sea surface temperatures
gradually increased up until the 19th, then fell
slightly to the end of the month. Overall though, the
SSTs were above normal. |
|
Mean pressure was
below the average for August and indicative of the
unsettled nature
of this month. |
|
A new sensor has been
added that measures solar irradiance in watts per square
metre falling on a horizontal surface. |
|
Dewpoints were well above
the average. |
|
As with the dewpoints, the relative humidity was
well-above normal. |
|
|
|
Weather Data for Otter Valley, Devon. |
August 2012 |
|
|
|
Temp (oC) |
Hum (RH%) |
Dewpoint (oC) |
Wind (mph) |
Rain |
Pressure (hPa) |
Grass |
Sun |
|
|
|
Min |
Max |
Ave |
Min |
Max |
Ave |
Min |
Max |
Ave |
Max |
Ave |
Run |
mm |
Min |
Max |
Ave |
Min |
Hours |
Observations |
|
1 |
15.1 |
20.6 |
17.9 |
75 |
98 |
87 |
13.6 |
17.8 |
15.7 |
25 |
4.9 |
116 |
2.6 |
1005 |
1012 |
1009 |
13.9 |
2.4 |
Sunny ints & light showers |
|
2 |
11.7 |
21.3 |
16.5 |
69 |
98 |
84 |
10.3 |
17.1 |
13.7 |
21 |
3.6 |
86 |
8.4 |
1006 |
1011 |
1008 |
9.6 |
6.2 |
Sunny ints & light showers |
|
3 |
12.1 |
19.9 |
16.0 |
76 |
98 |
87 |
10.6 |
16.1 |
13.4 |
25 |
5.1 |
121 |
0.0 |
1010 |
1012 |
1011 |
10.3 |
6.1 |
Sunny intervals all day |
|
4 |
13.8 |
19.1 |
16.5 |
80 |
98 |
89 |
12.1 |
16.7 |
14.4 |
21 |
5.9 |
141 |
2.4 |
1007 |
1010 |
1008 |
11.0 |
5.1 |
Showers am, sunny ints pm |
|
5 |
12.9 |
17.5 |
15.2 |
86 |
98 |
92 |
11.5 |
15.4 |
13.5 |
18 |
2.7 |
65 |
2.4 |
1004 |
1007 |
1006 |
11.2 |
0.7 |
Brief sunny intervals all day |
|
6 |
12.2 |
18.4 |
15.3 |
67 |
98 |
83 |
10.8 |
14.8 |
12.8 |
13 |
1.6 |
39 |
0.6 |
1005 |
1014 |
1009 |
9.5 |
2.7 |
Sunny intervals all day |
|
7 |
11.2 |
17.5 |
14.4 |
75 |
97 |
86 |
9.5 |
16.2 |
12.9 |
19 |
2.3 |
56 |
0.0 |
1014 |
1020 |
1017 |
10.1 |
0.3 |
Brief sunny intervals all day |
|
8 |
16.3 |
20.9 |
18.6 |
83 |
97 |
90 |
15.4 |
18.7 |
17.1 |
9 |
1.2 |
29 |
1.2 |
1021 |
1023 |
1022 |
15.9 |
0.6 |
Brief sunny intervals all day |
|
9 |
15.9 |
25.6 |
20.8 |
65 |
98 |
82 |
14.8 |
19.5 |
17.2 |
11 |
1.9 |
46 |
0.0 |
1023 |
1026 |
1024 |
13.8 |
10.4 |
Fog early am, then sunny |
|
10 |
13.7 |
25.1 |
19.4 |
54 |
98 |
76 |
12.6 |
17.1 |
14.9 |
8 |
0.8 |
19 |
0.0 |
1023 |
1026 |
1024 |
12.5 |
14.0 |
Sunny all day |
|
11 |
16.1 |
22.1 |
19.1 |
59 |
84 |
72 |
12.5 |
15.1 |
13.8 |
21 |
2.4 |
57 |
0.0 |
1013 |
1023 |
1018 |
13.3 |
10.8 |
Sunny ints. Thunder pm |
|
12 |
15.9 |
22.3 |
19.1 |
69 |
97 |
83 |
12.8 |
18.4 |
15.6 |
19 |
3.0 |
71 |
8.8 |
1010 |
1013 |
1012 |
14.9 |
6.2 |
Tstorms night. Sunny ints |
|
13 |
17.1 |
20.1 |
18.6 |
89 |
98 |
94 |
15.4 |
18.2 |
16.8 |
25 |
5.5 |
132 |
2.6 |
1008 |
1010 |
1009 |
13.2 |
3.2 |
Rain am, sunny ints pm |
|
14 |
14.1 |
22.7 |
18.4 |
78 |
98 |
88 |
13.5 |
18.8 |
16.2 |
12 |
2.0 |
48 |
0.0 |
1008 |
1010 |
1009 |
12.7 |
6.7 |
Sunny intervals all day |
|
15 |
18.6 |
20.0 |
19.3 |
75 |
97 |
86 |
14.3 |
17.1 |
15.7 |
35 |
7.0 |
168 |
21.0 |
1000 |
1008 |
1004 |
14.5 |
6.0 |
Rain am, sunny ints pm |
|
16 |
15.2 |
20.7 |
18.0 |
79 |
96 |
88 |
13.6 |
17.3 |
15.5 |
26 |
7.9 |
190 |
2.6 |
1004 |
1014 |
1009 |
14.5 |
3.4 |
Cloudy am, sunny ints pm |
|
17 |
16.1 |
22.6 |
19.4 |
75 |
98 |
87 |
15.1 |
19.0 |
17.1 |
25 |
6.4 |
154 |
14.0 |
1009 |
1012 |
1010 |
16.7 |
2.9 |
Rain am, sunny ints pm |
|
18 |
16.7 |
23.7 |
20.2 |
78 |
97 |
88 |
15.3 |
20.1 |
17.7 |
13 |
3.0 |
71 |
0.0 |
1011 |
1015 |
1013 |
16.6 |
8.7 |
Sunny intervals all day |
|
19 |
17.3 |
26.4 |
21.9 |
66 |
97 |
82 |
16.5 |
20.5 |
18.5 |
15 |
1.3 |
31 |
0.0 |
1014 |
1017 |
1015 |
14.7 |
4.7 |
Misty am, sunny ints pm |
|
20 |
16.1 |
23.7 |
19.9 |
70 |
98 |
84 |
14.3 |
18.9 |
16.6 |
12 |
1.7 |
44 |
0.0 |
1016 |
1021 |
1018 |
13.8 |
8.6 |
Sunny intervals all day |
|
21 |
14.7 |
21.0 |
17.9 |
70 |
98 |
84 |
12.4 |
17.3 |
14.9 |
17 |
2.4 |
59 |
0.0 |
1016 |
1021 |
1018 |
10.9 |
3.2 |
Sunny intervals all day |
|
22 |
9.7 |
22.2 |
16.0 |
54 |
98 |
76 |
8.4 |
14.3 |
11.4 |
16 |
1.9 |
46 |
0.0 |
1018 |
1020 |
1019 |
8.5 |
7.3 |
Sunny intervals all day |
|
23 |
10.3 |
19.6 |
15.0 |
73 |
98 |
86 |
9.1 |
15.2 |
12.2 |
16 |
2.0 |
49 |
0.0 |
1010 |
1019 |
1015 |
9.6 |
4.6 |
Sunny intervals all day |
|
24 |
13.1 |
17.2 |
15.2 |
91 |
98 |
95 |
11.9 |
16.8 |
14.4 |
21 |
3.1 |
69 |
11.4 |
999 |
1010 |
1004 |
12.7 |
1.0 |
Cloudy am, rain pm |
|
25 |
14.4 |
19.2 |
16.8 |
84 |
98 |
91 |
13.5 |
17.1 |
15.3 |
18 |
3.1 |
73 |
7.0 |
998 |
1009 |
1004 |
12.9 |
3.2 |
Sun & showers all day |
|
26 |
11.8 |
20.2 |
16.0 |
61 |
98 |
80 |
10.9 |
15.4 |
13.2 |
15 |
2.1 |
51 |
0.8 |
1010 |
1018 |
1014 |
9.3 |
6.2 |
Sunny ints am, cloudy pm |
|
27 |
15.1 |
18.3 |
16.7 |
89 |
98 |
94 |
11.6 |
16.8 |
14.2 |
28 |
7.0 |
168 |
6.8 |
1008 |
1018 |
1013 |
14.0 |
0.5 |
Brief sunny intervals all day |
|
28 |
9.6 |
20.7 |
15.2 |
77 |
99 |
88 |
8.8 |
17.3 |
13.1 |
21 |
3.4 |
82 |
1.6 |
1008 |
1015 |
1011 |
8.2 |
7.3 |
Sunny intervals all day |
|
29 |
13.6 |
18.3 |
16.0 |
74 |
99 |
87 |
12.4 |
16.0 |
14.2 |
24 |
7.1 |
171 |
18.0 |
1009 |
1014 |
1012 |
13.8 |
4.9 |
Rain am, sunny ints pm |
|
30 |
11.6 |
18.6 |
15.1 |
60 |
98 |
79 |
8.8 |
13.9 |
11.4 |
21 |
3.5 |
84 |
0.4 |
1011 |
1027 |
1019 |
0.0 |
10.1 |
Sunny intervals all day |
|
31 |
6.1 |
19.6 |
12.9 |
52 |
97 |
75 |
4.4 |
11.2 |
7.8 |
13 |
1.5 |
37 |
0.0 |
1027 |
1032 |
1030 |
0.0 |
9.3 |
Sunny intervals all day |
|
|
13.8 |
20.8 |
17.3 |
73 |
97 |
85 |
12.2 |
16.9 |
14.5 |
19 |
3.5 |
2569 |
112.6 |
1010 |
1016 |
1013 |
12.5 |
167.4 |
|
Graphs for
August 2012 |
 |
|
Figure 1. Temperature and
Rainfall for August 2012. |
 |
|
Figure 2. Sunshine, UV
Index and solar irradiance for August 2012. |
 |
|
Figure 3.
Wind direction for August 2012. |
 |
|
Figure 4. Sea surface
temperature & cooling/heating days for August 2012. |
 |
|
Figure 5.
Mean wind speed, calm hours and air pressure for August 2012. |
|