|
June 2012 |
|
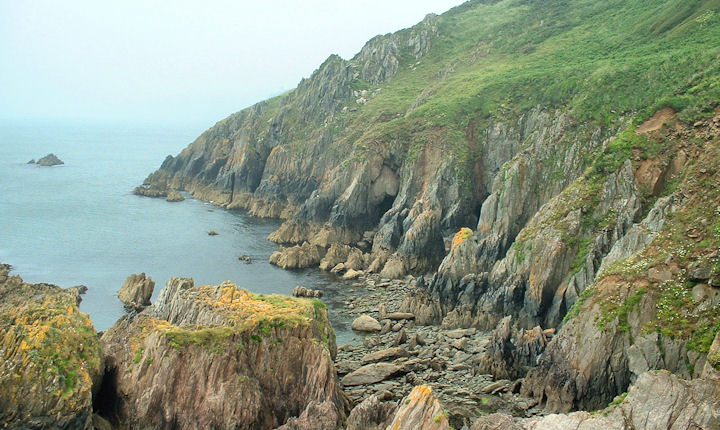
Jagged, slate-like schist rocks along the south
coast of Devon.
These are some of the oldest rocks in Devon at
around 500 million years old. |
|
Summary for |
June
2012 |
|
Mean Max: |
17.8ºC |
(-1.3ºC) |
|
Mean Min: |
11.3ºC |
(+1.0ºC) |
|
Mean: |
14.6ºC |
(-0.1ºC) |
|
|
|
|
|
High Max: |
23.9ºC |
28th |
|
Low Max: |
14.2ºC |
10th |
|
High Min: |
15.7ºC |
28th |
|
Low Min: |
6.8ºC |
19th |
|
Mean Grass Min: |
10.9ºC |
|
|
Grass Min: |
5.6ºC |
19th |
|
|
|
|
|
Rain Total (gauge): |
141.6 mm |
(342%) |
|
Rain Total (tipping bucket): |
138.2 mm |
(338%) |
|
Rain Days >0.2 mm: |
21 Days |
|
|
Rain Days >1.0 mm: |
18 Days |
|
|
Max 24 hrs: |
23.2 mm |
7th |
|
Days without any rain: |
8 |
|
|
|
|
|
|
Air Frost: |
0 Days |
|
|
Grass Frost: |
0 Days |
|
|
Snow Falling: |
0 Days |
|
|
Snow (50%) @ 9am: |
0 Days |
|
|
Thunder Heard: |
1 Days |
|
|
Hail <5 mm: |
0 Days |
|
|
Hail >5 mm: |
0 Days |
|
|
Fog @ 9am: |
0 Days |
|
|
|
|
|
|
Total Monthly Sunshine: |
106.3 Hours |
(46%) |
|
Most Sunshine in a Day: |
15.6 Hours |
19th |
|
Average Daily Sunshine: |
3.5 Hours |
|
|
Sunless Days: |
3 Days |
|
|
Cloudless Days: |
1 Days |
|
|
Total Possible Sunshine: |
492.4 Hours |
|
|
Percentage of Total Sun: |
22% |
|
|
Maximum UV Index: |
8.9 |
2nd |
|
Time of Max UV: |
|
13:00 |
|
|
|
|
|
Mean Soil Temp @ 30 cm: |
|
|
|
Min Soil Temp @ 30 cm: |
|
|
|
Max Soil Temp @ 30 cm: |
|
|
|
Mean Soil Temp @ 100 cm: |
|
|
|
Min Soil Temp @ 100 cm: |
|
|
|
Max Soil Temp @ 100 cm: |
|
|
|
|
|
|
|
Mean 10 Min Wind >39 mph: |
0.01 Days |
|
|
N: |
3.57 Days |
|
|
NE: |
0.60 Days |
|
|
E: |
2.85 Days |
|
|
SE: |
2.11 Days |
|
|
S: |
12.55 Days |
|
|
SW: |
5.46 Days |
|
|
W: |
0.30 Days |
|
|
NW: |
1.34 Days |
|
|
Calm: |
1.21 Days |
|
|
Wind Chill Low: |
6.6ºC |
19th |
|
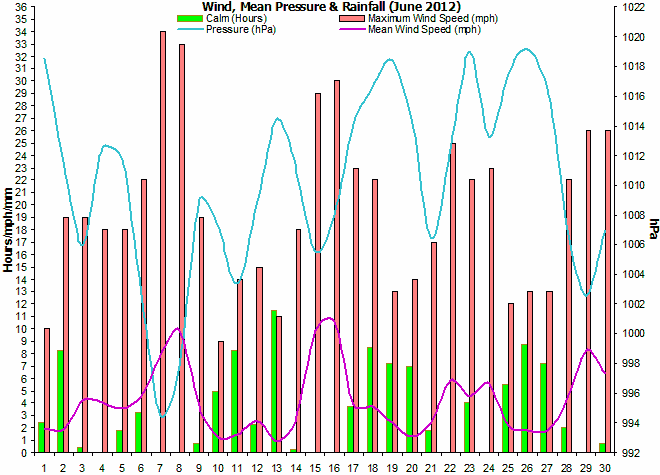
Mean Wind: |
4.2 mph |
|
|
Max Gust: |
34 mph |
7th |
|
|
30.00 Days |
|
|
Mean Cloud Cover: |
73% |
|
|
Mean RH @ 9am: |
91% |
|
|
Rain Duration >0.1mm/hour: |
78.8 Hours |
|
|
Frost Duration: |
0.0 Hours |
|
|
Max Frost Duration in a Day: |
0.0 Hours |
1st |
|
|
|
|
|
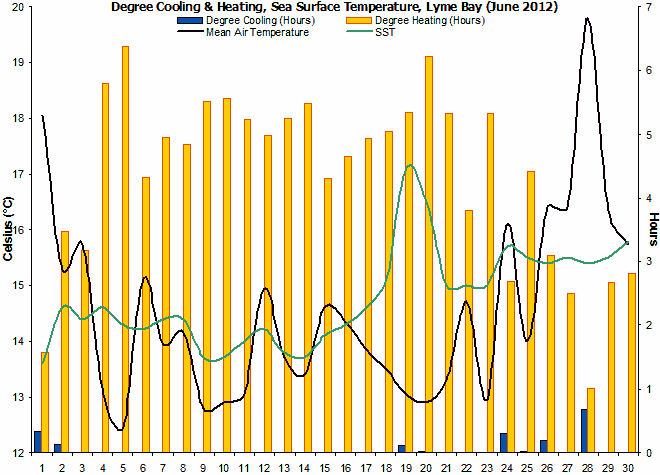
Mean Sea Temperature: |
14.8ºC |
(-0.5ºC) |
|
Normal for Month: |
15.3ºC |
|
|
Max Sea Temperature: |
17.1ºC |
19th |
|
Min Sea Temperature: |
13.6ºC |
1st |
|
|
|
|
|
Mean Pressure @ 9am: |
1010.5 hPa |
(-6.9 hPa) |
|
Mean Pressure: |
1010.2 hPa |
(-7.2 hPa) |
|
Max Pressure: |
1021.2 hPa |
23rd |
|
Min Pressure: |
987.3 hPa |
7th |
|
|
|
|
|
Radiation Daily Mean: |
14.8 MJ/m² |
|
|
Max Daily Value: |
33.1 MJ/m² |
19th |
|
Min Daily Value: |
5.7 MJ/m² |
7th |
|
Number of Days with Data: |
31 Days |
|
|
1-Hour Maximum: |
1204 W/m² |
9th |
|
Starting Time of the Hour: |
|
13:00 |
|
|
|
|
|
Max Dewpoint: |
19.3ºC |
28th |
|
Min Dewpoint: |
5.7ºC |
19th |
|
Mean Dewpoint: |
11.9ºC |
|
|
|
|
|
|
Max Humidity: |
98% |
2nd |
|
Min Humidity: |
56% |
24th |
|
Mean Humidity: |
85% |
(+9) |
|
|
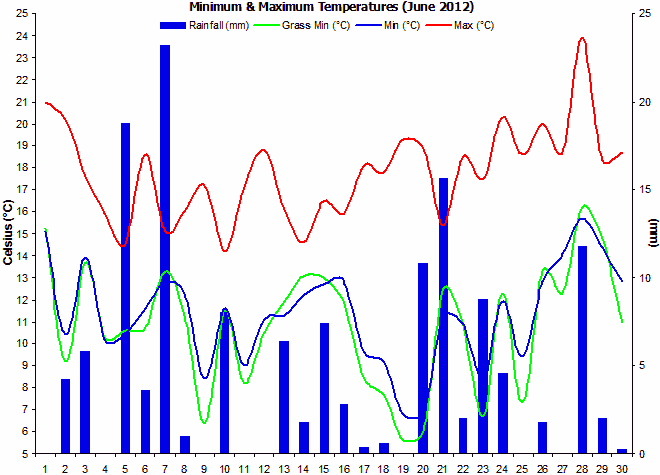
A cool, wet and very dull month.
This
June was the dullest and wettest in my record. It was
also very cool at times, though the mean temperature was
only -0.1°C, this was due to the warmth of the nights
rather than any daytime warmth. A maximum monthly
temperature of just 23.9°C, is the lowest such figure
this station has ever recorded for a summer month. |
|
Rainfall was exceptional,
with over 3 times the normal falling. June is normally
one of the driest months of the year. |
|
As
expected in a summer month, there
were no air frosts or grass frosts. Thunder was only
heard once, and it was a spectacular night storm with
frequent, overhead lightning and thunder. |
|
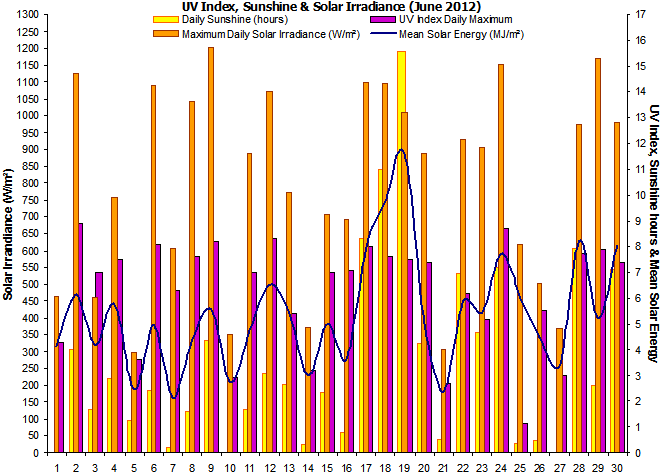
Sunshine
levels were exceptionally low, and this month only ended
up slightly sunnier than February! Easily the dullest
summer month this station has recorded. |
|
No soil temperature
readings were taken due to relocation of sensors. These
are planned to be installed in July 2012. |
|
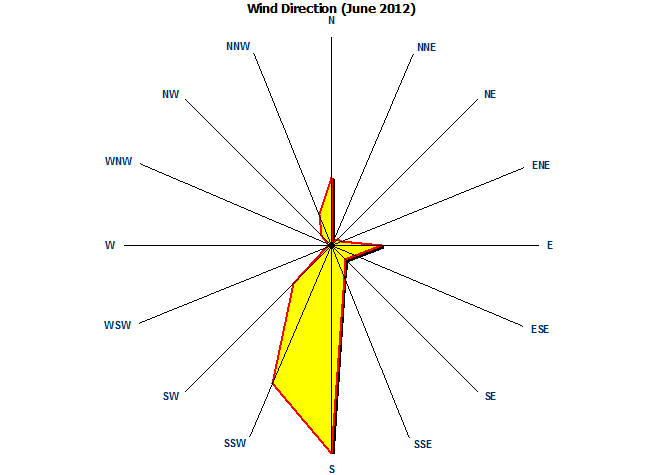
The dominant wind direction was
from a southerly direction. This was due to
frequent sea breezes and typical for a summer month. |
|
Rainfall duration was 79
hours, and representative of the very wet nature of this
month. |
|
Sea surface temperatures
gradually increased up until the 19th, then fell
slightly through the rest of the month. The SST ended up
rather below normal. |
|
Mean pressure was
well-below the average for June and indicative of the
very unsettled nature
of this month. |
|
A new sensor has been
added that measures solar irradiance in watts per square
metre falling on a horizontal surface. |
|
Dewpoints were often above
the average, and on the 28th the dewpoint reached
19.3°C. |
|
As with the dewpoints, the relative humidity was
well-above normal. |
|
|
|
Weather Data for Otter Valley, Devon. |
June 2012 |
|
|
|
Temp (oC) |
Hum (RH%) |
Dewpoint (oC) |
Wind (mph) |
Rain |
Pressure (hPa) |
Grass |
Sun |
|
|
|
Min |
Max |
Ave |
Min |
Max |
Ave |
Min |
Max |
Ave |
Max |
Ave |
Run |
mm |
Min |
Max |
Ave |
Min |
Hours |
Observations |
|
1 |
15.1 |
21.0 |
18.1 |
73 |
92 |
83 |
13.5 |
16.8 |
15.2 |
10 |
1.9 |
46 |
0.0 |
1017 |
1020 |
1019 |
15.2 |
0.0 |
Cloudy all day |
|
2 |
10.4 |
20.2 |
15.3 |
75 |
98 |
87 |
9.4 |
16.2 |
12.8 |
19 |
1.9 |
45 |
4.2 |
1006 |
1017 |
1012 |
9.2 |
4.0 |
Sunny intervals all day |
|
3 |
13.9 |
17.6 |
15.8 |
76 |
96 |
86 |
11.9 |
14.4 |
13.2 |
19 |
4.2 |
101 |
5.8 |
1005 |
1007 |
1006 |
13.7 |
1.7 |
Brief sunny intervals all day |
|
4 |
10.2 |
15.9 |
13.1 |
64 |
92 |
78 |
7.5 |
11.5 |
9.5 |
18 |
4.0 |
97 |
0.0 |
1007 |
1019 |
1013 |
10.3 |
2.9 |
Sunny intervals all day |
|
5 |
10.4 |
14.5 |
12.5 |
81 |
98 |
90 |
8.1 |
14.0 |
11.1 |
18 |
3.5 |
85 |
18.8 |
1005 |
1019 |
1012 |
10.6 |
1.3 |
Brief sunny intervals all day |
|
6 |
11.6 |
18.6 |
15.1 |
75 |
98 |
87 |
10.7 |
16.3 |
13.5 |
22 |
4.6 |
111 |
3.6 |
1000 |
1005 |
1003 |
10.7 |
2.4 |
Rain am, sunny intervals pm |
|
7 |
12.8 |
15.1 |
14.0 |
85 |
98 |
92 |
11.7 |
14.2 |
13.0 |
34 |
7.9 |
189 |
23.2 |
987 |
1002 |
995 |
13.3 |
0.2 |
Rain, int all day. Stormy pm. |
|
8 |
12.3 |
16.0 |
14.2 |
63 |
92 |
78 |
7.8 |
11.5 |
9.7 |
33 |
9.8 |
236 |
1.0 |
989 |
1007 |
998 |
11.3 |
1.6 |
Sunny intervals all day |
|
9 |
8.4 |
17.2 |
12.8 |
60 |
95 |
78 |
6.6 |
11.9 |
9.3 |
19 |
3.8 |
92 |
0.0 |
1007 |
1011 |
1009 |
6.4 |
4.4 |
Sunny intervals all day |
|
10 |
11.6 |
14.2 |
12.9 |
86 |
96 |
91 |
10.2 |
13.2 |
11.7 |
9 |
1.3 |
30 |
8.0 |
1004 |
1011 |
1007 |
11.5 |
0.0 |
Rain all day |
|
11 |
9.0 |
17.1 |
13.1 |
71 |
98 |
85 |
8.0 |
13.4 |
10.7 |
14 |
1.4 |
35 |
0.0 |
1002 |
1005 |
1003 |
8.2 |
1.7 |
Brief sunny intervals all day |
|
12 |
11.1 |
18.8 |
15.0 |
64 |
93 |
79 |
9.5 |
12.3 |
10.9 |
15 |
2.6 |
62 |
0.0 |
1005 |
1013 |
1009 |
10.5 |
3.1 |
Sunny intervals all day |
|
13 |
11.3 |
16.1 |
13.7 |
80 |
97 |
89 |
10.3 |
13.3 |
11.8 |
11 |
0.9 |
22 |
6.4 |
1013 |
1016 |
1014 |
11.9 |
2.7 |
Brief sunny intervals all day |
|
14 |
12.2 |
14.6 |
13.4 |
82 |
95 |
89 |
10.1 |
13.0 |
11.6 |
18 |
2.7 |
64 |
1.8 |
1006 |
1016 |
1011 |
13.1 |
0.3 |
Cloudy all day, rain evening |
|
15 |
12.7 |
16.5 |
14.6 |
73 |
97 |
85 |
10.9 |
13.4 |
12.2 |
29 |
9.9 |
237 |
7.4 |
1005 |
1007 |
1006 |
13.0 |
2.3 |
Sunny intervals all day |
|
16 |
12.8 |
15.9 |
14.4 |
81 |
92 |
87 |
10.5 |
13.3 |
11.9 |
30 |
10.7 |
256 |
2.8 |
1005 |
1011 |
1008 |
11.8 |
0.8 |
Brief sunny intervals all day |
|
17 |
9.6 |
18.1 |
13.9 |
74 |
97 |
86 |
8.3 |
14.1 |
11.2 |
23 |
3.9 |
94 |
0.4 |
1011 |
1017 |
1014 |
8.4 |
8.3 |
Sunny intervals all day |
|
18 |
9.2 |
17.8 |
13.5 |
73 |
97 |
85 |
7.8 |
13.8 |
10.8 |
22 |
3.8 |
90 |
0.6 |
1015 |
1018 |
1017 |
7.7 |
11.0 |
Sunny intervals all day |
|
19 |
6.8 |
19.3 |
13.1 |
59 |
98 |
79 |
5.7 |
13.0 |
9.4 |
13 |
2.4 |
58 |
0.0 |
1017 |
1019 |
1018 |
5.6 |
15.6 |
Sunny all day |
|
20 |
6.9 |
18.9 |
12.9 |
58 |
98 |
78 |
5.8 |
13.0 |
9.4 |
14 |
1.3 |
35 |
10.8 |
1010 |
1018 |
1014 |
6.0 |
4.2 |
Sunny intervals all day |
|
21 |
11.2 |
15.4 |
13.3 |
89 |
97 |
93 |
9.9 |
14.1 |
12.0 |
17 |
2.5 |
61 |
15.6 |
1003 |
1010 |
1006 |
12.4 |
0.5 |
Rain all day |
|
22 |
10.9 |
18.5 |
14.7 |
60 |
97 |
79 |
9.0 |
12.3 |
10.7 |
25 |
5.8 |
140 |
2.0 |
1006 |
1019 |
1012 |
10.8 |
7.0 |
Sunny intervals all day |
|
23 |
8.4 |
17.5 |
13.0 |
66 |
98 |
82 |
7.4 |
12.1 |
9.8 |
22 |
4.6 |
111 |
8.8 |
1017 |
1021 |
1019 |
6.7 |
4.6 |
Sunny int am, rain evening |
|
24 |
11.9 |
20.3 |
16.1 |
56 |
97 |
77 |
10.7 |
13.6 |
12.2 |
23 |
5.6 |
122 |
4.6 |
1010 |
1017 |
1013 |
12.3 |
7.2 |
Cloudy am, sunny pm |
|
25 |
9.4 |
18.6 |
14.0 |
69 |
97 |
83 |
8.7 |
14.2 |
11.5 |
12 |
2.2 |
52 |
0.0 |
1016 |
1019 |
1018 |
7.3 |
0.4 |
Brief sunny intervals all day |
|
26 |
12.8 |
20.0 |
16.4 |
85 |
97 |
91 |
11.5 |
18.3 |
14.9 |
13 |
1.8 |
44 |
1.8 |
1018 |
1020 |
1019 |
13.3 |
0.5 |
Brief sunny intervals all day |
|
27 |
14.1 |
18.7 |
16.4 |
88 |
98 |
93 |
12.8 |
16.7 |
14.8 |
13 |
1.8 |
42 |
0.0 |
1013 |
1020 |
1017 |
12.3 |
0.0 |
Cloudy all day |
|
28 |
15.7 |
23.9 |
19.8 |
72 |
98 |
85 |
12.7 |
19.3 |
16.0 |
22 |
4.2 |
101 |
11.8 |
1002 |
1013 |
1007 |
16.2 |
8.0 |
Misty am, sunny intervals pm |
|
29 |
14.4 |
18.3 |
16.4 |
76 |
97 |
87 |
12.8 |
15.8 |
14.3 |
26 |
8.2 |
197 |
2.0 |
1001 |
1004 |
1003 |
14.8 |
2.6 |
Sunny ints am, lshowers pm |
|
30 |
12.8 |
18.7 |
15.8 |
68 |
96 |
82 |
10.7 |
14.3 |
12.5 |
26 |
6.4 |
154 |
0.2 |
1004 |
1010 |
1007 |
11.0 |
7.1 |
Sunny intervals all day |
|
|
11.3 |
17.8 |
14.6 |
73 |
96 |
85 |
9.7 |
14.1 |
11.9 |
20 |
4.2 |
3006 |
141.6 |
1007 |
1014 |
1010 |
10.9 |
106.3 |
|
Graphs for
June 2012 |
 |
|
Figure 1. Temperature and
Rainfall for June 2012. |
 |
|
Figure 2. Sunshine, UV
Index and solar irradiance for June 2012. |
 |
|
Figure 3.
Wind direction for June 2012. |
 |
|
Figure 4. Sea surface
temperature & cooling/heating days for June 2012. |
 |
|
Figure 5.
Mean wind speed, calm hours and air pressure for June 2012. |
|