|
November 2012 |
|
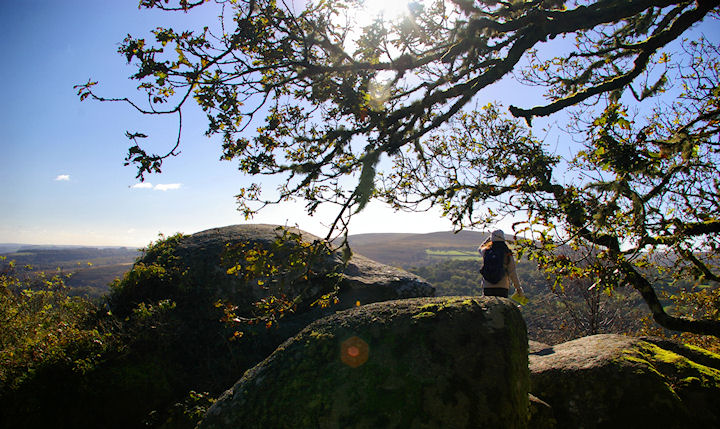
Mushroom Rock, Lustleigh Cleeve, Devon
taken on a bright, crisp November day. |
|
Summary for |
November
2012 |
|
Mean Max: |
11.6ºC |
(+0.2ºC) |
|
Mean Min: |
4.7ºC |
(-0.3ºC) |
|
Mean: |
8.2ºC |
(-0.0ºC) |
|
|
|
|
|
High Max: |
14.7ºC |
14th |
|
Low Max: |
6.1ºC |
30th |
|
High Min: |
11.1ºC |
14th |
|
Low Min: |
-2.9ºC |
29th |
|
Mean Grass Min: |
1.7ºC |
|
|
Grass Min: |
-5.3ºC |
29th |
|
|
|
|
|
Rain Total (gauge): |
187.3 mm |
(300%) |
|
Rain Total (tipping bucket): |
183.8 mm |
|
|
Rain Days >0.2 mm: |
17 Days |
|
|
Rain Days >1.0 mm: |
15 Days |
|
|
Max 24 hrs: |
41.7 mm |
21st |
|
Days without any rain: |
13 |
|
|
|
|
|
|
Air Frost: |
4 Days |
|
|
Grass Frost: |
8 Days |
|
|
Snow Falling: |
0 Days |
|
|
Snow (50%) @ 9am: |
0 Days |
|
|
Ice Days: |
0 Days |
|
|
Thunder Heard: |
0 Days |
|
|
Hail <5 mm: |
0 Days |
|
|
Hail >5 mm: |
0 Days |
|
|
Fog @ 9am: |
2 Days |
|
|
|
|
|
|
Total Monthly Sunshine: |
93.8 Hours |
(101%) |
|
Most Sunshine in a Day: |
8.4 Hours |
11th |
|
Average Daily Sunshine: |
3.1 Hours |
|
|
Sunless Days: |
7 Days |
|
|
Cloudless Days: |
3 Days |
|
|
Total Possible Sunshine: |
268.9 Hours |
|
|
Percentage of Total Sun: |
35% |
|
|
Maximum UV Index: |
1.6 |
2nd |
|
Time of Max UV: |
|
12:00 |
|
|
|
|
|
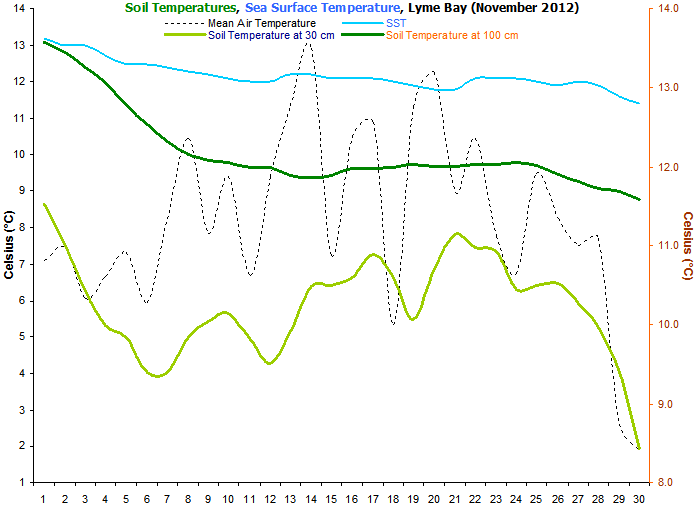
Mean Soil Temp @ 30 cm: |
10.2ºC |
|
|
Min Soil Temp @ 30 cm: |
8.4ºC |
30th |
|
Max Soil Temp @ 30 cm: |
11.5ºC |
1st |
|
Mean Soil Temp @ 100 cm: |
12.2ºC |
|
|
Min Soil Temp @ 100 cm: |
11.6ºC |
30th |
|
Max Soil Temp @ 100 cm: |
13.6ºC |
1st |
|
|
|
|
|
Mean 10 Min Wind >39 mph: |
0.00 Days |
|
|
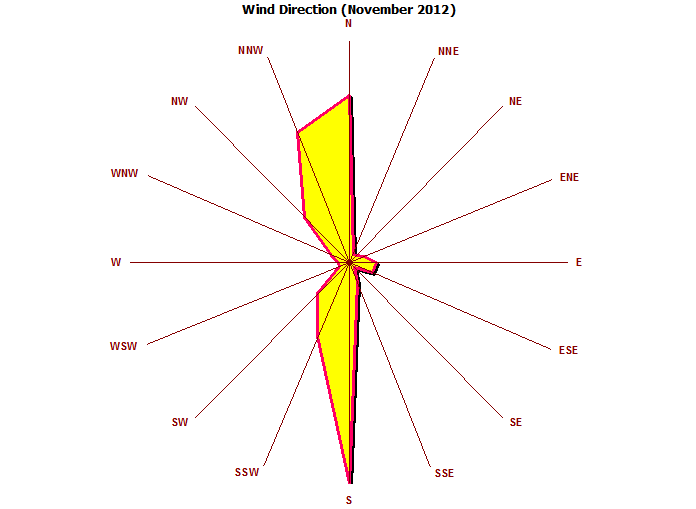
N: |
7.28 Days |
|
|
NE: |
0.68 Days |
|
|
E: |
1.46 Days |
|
|
SE: |
0.95 Days |
|
|
S: |
8.24 Days |
|
|
SW: |
2.72 Days |
|
|
W: |
0.74 Days |
|
|
NW: |
4.31 Days |
|
|
Calm: |
3.63 Days |
|
|
Wind Chill Low: |
-3.1ºC |
29th |
|
Mean Wind: |
3.1 mph |
|
|
Max Gust: |
53 mph |
22nd |
|
|
|
|
|
Mean Cloud Cover: |
64% |
|
|
Mean RH @ 9am: |
95% |
|
|
Rain Duration >0.1mm/hour: |
74.3 Hours |
|
|
Frost Duration: |
34.0 Hours |
|
|
Max Frost Duration in a Day: |
13.3 Hours |
30th |
|
|
|
|
|
Mean Sea Temperature: |
12.2ºC |
(-0.6ºC) |
|
Normal for Month: |
12.8ºC |
|
|
Max Sea Temperature: |
13.2ºC |
1st |
|
Min Sea Temperature: |
11.4ºC |
30th |
|
|
|
|
|
Mean Pressure @ 9am: |
1010.1 hPa |
(-5.6 hPa) |
|
Mean Pressure: |
1009.5 hPa |
(-6.2 hPa) |
|
Max Pressure: |
1028.6 hPa |
7th |
|
Min Pressure: |
976.6 hPa |
1st |
|
Max Change in 24 hours: |
23.2 hPa |
5th |
|
|
|
|
|
Radiation Daily Mean: |
4.2 MJ/m² |
|
|
Max Daily Value: |
8.7 MJ/m² |
5th |
|
Min Daily Value: |
0.5 MJ/m² |
24th |
|
Number of Days with Data: |
30 Days |
|
|
1-Hour Maximum: |
549 W/m² |
1st |
|
Starting Time of the Hour: |
|
12:00 |
|
|
|
|
|
Max Dewpoint: |
13.4ºC |
20th |
|
Min Dewpoint: |
-3.7ºC |
29th |
|
Mean Dewpoint: |
6.0ºC |
|
|
|
|
|
|
Max Humidity: |
99% |
1st |
|
Min Humidity: |
67% |
1st |
|
Mean Humidity: |
88% |
(+2) |
|
|
Benign,
mild, sunny and dry until the 20th, then wild, often
windy and very wet.
Mild and
often rather settled right through until the 20th then a
big change to windier and wetter conditions but
remaining mild until the last few days of the month. The
last two days had fairly sharp frosts for this location. |
|
November is normally a wet
month but this month it was very wet with extremely
heavy rainfall falling between the 20th and the 26th.
This led to serious flooding for the 4th time this year,
and also many landslips and cliff-falls. |
|
November
often sees the first air frosts of the season, and this
year was no exception. Though the frosts at the end of
the month were a little sharper than normal. As usual
for November, no snow was seen falling or lying. |
|
Sunshine
amounts were around average despite a very dull 4th
week. This cloudy week led to a high amount of days
without any sunshine, though there were 3 cloudless days
of unbroken sunshine to compensate. |
|
Soil temperatures slowly
declined throughout the month, with the temperature
dropping more rapidly with the arrival of colder weather
during the final week of the month. |
|
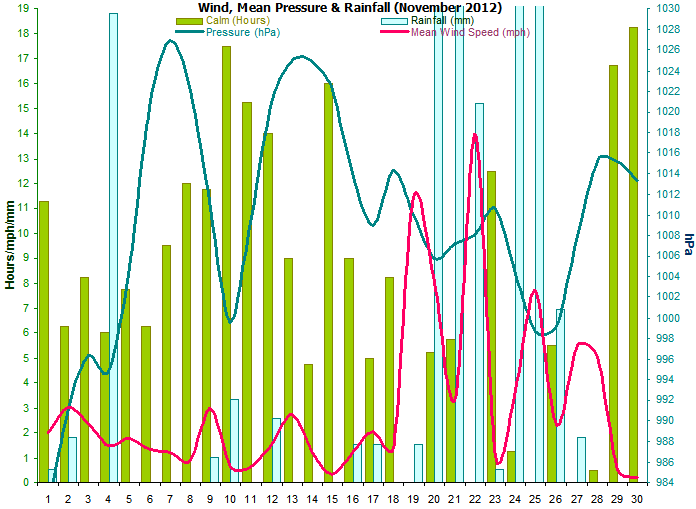
An extremely windy day on
the 22nd with a total wind run of 304 miles. Gusts of
over 50 mph were recorded for much of the day leading to
many fallen trees and rock falls along the coast due to
rough seas eroding the base of the cliffs. Winds
dominated from the northerly and southerly directions.
Overall though, the mean wind speed was only 3.1 mph
despite the very windy spell during the 4th week. This
was due to the benign, rather windless conditions that
dominated the first 3 weeks of the month. |
|
The rainfall duration of
74 hours does not reflect the high amount of rainfall
that actually fell during this month. This was due to
the rain being predominantly heavy in nature. |
|
Sea surface temperatures
stayed reasonably high until the 28th then dropped
significantly due to a run of cold nights. |
|
Mean pressure was rather
below the average for November despite the reasonably
settled first 3 weeks. |
|
A new sensor has been
added that measures solar irradiance in watts per square
metre falling on a horizontal surface. |
|
Dewpoints were slightly
below
the average. |
|
Relative humidity was
a little above normal. |
|
|
|
Weather Data for Otter Valley, Devon. |
November 2012 |
|
|
|
Temp oC |
Grass |
Hum (%) |
Soil oC |
DP (oC) |
Wind (mph) |
Rain |
Air (hPa) |
W/m² |
UV |
Sun |
|
|
|
Min |
Max |
Min |
Min |
Max |
30 |
100 |
Min |
Max |
Max |
Ave |
Run |
mm |
Min |
Max |
Max |
Max |
Hours |
Observations |
|
1 |
3.1 |
11.1 |
1.4 |
67 |
99 |
11.5 |
13.6 |
2.5 |
7.3 |
20 |
2.0 |
47 |
0.5 |
977 |
987 |
549 |
1.4 |
6.4 |
Sunny intervals all day |
|
2 |
3.2 |
11.7 |
-0.1 |
68 |
97 |
11.0 |
13.5 |
1.8 |
6.0 |
18 |
3.0 |
72 |
1.8 |
987 |
996 |
518 |
1.6 |
5.3 |
Sun & light showers all day |
|
3 |
1.6 |
10.5 |
-0.4 |
69 |
98 |
10.4 |
13.3 |
0.8 |
5.4 |
16 |
2.4 |
57 |
0.0 |
994 |
999 |
431 |
1.3 |
4.0 |
Sunny intervals all day |
|
4 |
2.2 |
11.1 |
0.9 |
84 |
98 |
10.0 |
13.1 |
0.8 |
8.6 |
14 |
1.5 |
36 |
18.8 |
991 |
999 |
471 |
1.3 |
6.7 |
Sunshine & showers all day |
|
5 |
3.4 |
11.2 |
0.0 |
67 |
99 |
9.8 |
12.8 |
1.1 |
7.0 |
16 |
1.8 |
42 |
0.0 |
993 |
1017 |
479 |
1.2 |
7.4 |
Sunny intervals all day |
|
6 |
-0.6 |
12.5 |
-2.1 |
72 |
99 |
9.4 |
12.5 |
-1.4 |
8.9 |
15 |
1.4 |
33 |
0.0 |
1017 |
1026 |
442 |
1.4 |
5.5 |
Sunny intervals all day |
|
7 |
4.2 |
12.3 |
1.0 |
75 |
99 |
9.4 |
12.3 |
3.3 |
8.5 |
11 |
1.2 |
29 |
0.0 |
1025 |
1029 |
314 |
1.2 |
0.6 |
Brief sunny intervals all day |
|
8 |
7.4 |
13.5 |
1.5 |
68 |
98 |
9.8 |
12.2 |
3.4 |
10.0 |
10 |
0.9 |
22 |
0.0 |
1019 |
1025 |
381 |
1.4 |
3.2 |
Sunny intervals all day |
|
9 |
4.9 |
10.8 |
3.0 |
83 |
98 |
10.0 |
12.1 |
3.6 |
8.9 |
17 |
3.0 |
72 |
1.0 |
1002 |
1019 |
104 |
0.6 |
0.0 |
Cloudy all day |
|
10 |
6.1 |
12.7 |
1.5 |
68 |
99 |
10.1 |
12.1 |
3.5 |
8.7 |
12 |
0.6 |
16 |
3.3 |
997 |
1002 |
439 |
1.3 |
6.5 |
Sunny intervals all day |
|
11 |
0.3 |
13.1 |
-1.0 |
68 |
99 |
9.8 |
12.0 |
-0.3 |
8.1 |
10 |
0.6 |
15 |
0.0 |
1001 |
1019 |
480 |
1.2 |
8.4 |
Sunny all day |
|
12 |
4.8 |
14.0 |
3.0 |
93 |
99 |
9.5 |
12.0 |
3.9 |
13.0 |
15 |
1.6 |
39 |
2.6 |
1019 |
1023 |
142 |
0.8 |
0.4 |
Brief sunny intervals all day |
|
13 |
8.8 |
13.9 |
4.0 |
87 |
99 |
9.9 |
11.9 |
6.0 |
13.1 |
19 |
2.7 |
66 |
0.0 |
1023 |
1027 |
169 |
1.0 |
0.0 |
Cloudy all day |
|
14 |
11.1 |
14.7 |
2.3 |
73 |
97 |
10.5 |
11.9 |
4.1 |
11.4 |
12 |
1.2 |
29 |
0.0 |
1024 |
1026 |
465 |
1.3 |
6.3 |
Sunny intervals all day |
|
15 |
4.1 |
10.4 |
1.8 |
86 |
99 |
10.5 |
11.9 |
3.2 |
8.4 |
7 |
0.3 |
8 |
0.0 |
1020 |
1025 |
101 |
0.6 |
0.0 |
Cloudy all day |
|
16 |
8.6 |
12.4 |
8.6 |
92 |
98 |
10.6 |
12.0 |
7.5 |
11.9 |
11 |
1.3 |
30 |
1.5 |
1008 |
1020 |
80 |
0.6 |
0.0 |
Cloudy all day |
|
17 |
9.0 |
12.8 |
1.5 |
79 |
99 |
10.9 |
12.0 |
3.7 |
12.5 |
14 |
2.0 |
49 |
1.5 |
1006 |
1012 |
262 |
1.0 |
1.6 |
Sunny ints am, cloudy pm |
|
18 |
-0.4 |
11.1 |
-1.4 |
75 |
99 |
10.6 |
12.0 |
-0.9 |
7.8 |
18 |
1.4 |
34 |
0.0 |
1012 |
1016 |
390 |
1.0 |
6.1 |
Sunny all day |
|
19 |
10.1 |
12.5 |
6.5 |
74 |
98 |
10.1 |
12.0 |
4.8 |
12.1 |
34 |
11.4 |
273 |
1.5 |
1007 |
1014 |
83 |
0.5 |
0.0 |
Cloudy all day |
|
20 |
10.7 |
13.8 |
9.9 |
94 |
99 |
10.7 |
12.0 |
10.1 |
13.4 |
33 |
8.0 |
208 |
19.3 |
1004 |
1008 |
80 |
0.0 |
0.0 |
Rain am, cloudy pm |
|
21 |
5.6 |
12.3 |
1.9 |
78 |
99 |
11.1 |
12.0 |
5.0 |
10.9 |
23 |
3.4 |
81 |
41.7 |
1000 |
1015 |
449 |
1.0 |
3.9 |
Rain am, sunny intervals pm |
|
22 |
8.0 |
12.9 |
4.4 |
87 |
96 |
11.0 |
12.0 |
6.6 |
11.4 |
53 |
14.0 |
304 |
15.2 |
1003 |
1014 |
82 |
0.5 |
0.4 |
Sunny ints am, very windy. |
|
23 |
3.6 |
11.9 |
1.0 |
82 |
99 |
10.9 |
12.0 |
2.1 |
9.7 |
12 |
1.1 |
27 |
0.5 |
1006 |
1016 |
362 |
1.0 |
2.2 |
Sunny intervals all day |
|
24 |
2.3 |
11.2 |
0.9 |
97 |
99 |
10.4 |
12.1 |
1.7 |
10.8 |
22 |
3.7 |
82 |
39.6 |
993 |
1016 |
35 |
0.0 |
0.0 |
Rain all day |
|
25 |
6.8 |
12.2 |
3.1 |
80 |
99 |
10.5 |
12.0 |
4.2 |
12.0 |
36 |
7.7 |
183 |
30.1 |
990 |
1008 |
287 |
0.9 |
2.3 |
Sunny ints am, showers pm |
|
26 |
6.1 |
10.4 |
3.6 |
87 |
99 |
10.5 |
11.9 |
5.7 |
8.7 |
24 |
2.3 |
56 |
6.9 |
996 |
1003 |
398 |
0.8 |
2.6 |
Showers am, sunny ints pm |
|
27 |
5.7 |
9.3 |
3.9 |
82 |
95 |
10.3 |
11.8 |
4.3 |
7.3 |
19 |
5.5 |
132 |
1.8 |
1003 |
1013 |
252 |
0.8 |
0.7 |
Sunny intervals all day |
|
28 |
6.5 |
8.9 |
-1.4 |
69 |
91 |
10.0 |
11.7 |
0.7 |
5.0 |
20 |
5.1 |
122 |
0.0 |
1013 |
1018 |
404 |
1.0 |
3.6 |
Sunny intervals all day |
|
29 |
-2.9 |
8.1 |
-5.3 |
69 |
98 |
9.4 |
11.7 |
-3.7 |
2.8 |
9 |
0.5 |
13 |
0.0 |
1013 |
1018 |
376 |
0.9 |
7.7 |
Sunny all day |
|
30 |
-2.3 |
6.1 |
-4.5 |
84 |
97 |
8.4 |
11.6 |
-3.2 |
3.7 |
4 |
0.2 |
5 |
0.0 |
1012 |
1015 |
302 |
0.8 |
2.0 |
Sunny intervals all day |
|
|
4.7 |
11.6 |
1.7 |
79 |
98 |
10 |
12.2 |
2.8 |
9.1 |
18 |
3.1 |
2179 |
187.8 |
1005 |
1014 |
311 |
0.9 |
94 |
|
Graphs for
November 2012 |
 |
|
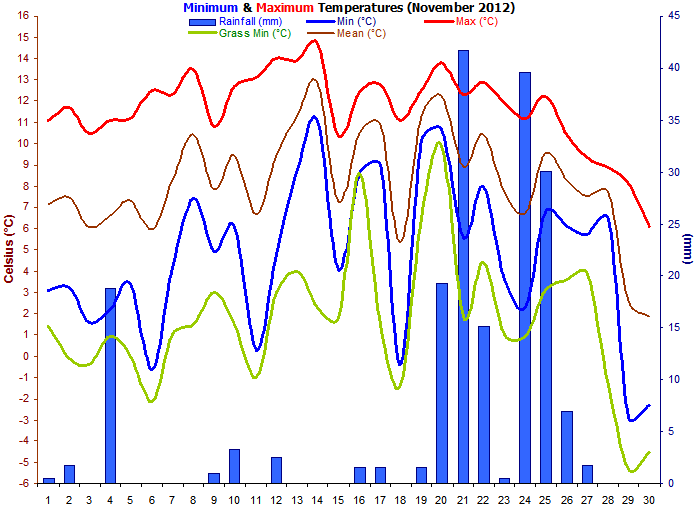
Figure 1. Temperature and
Rainfall for November 2012. |
 |
|
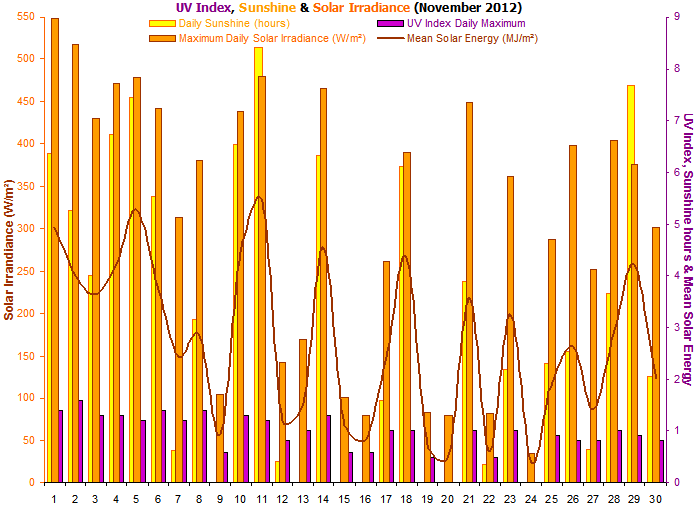
Figure 2. Sunshine, UV
Index and solar irradiance for November 2012. |
 |
|
Figure 3.
Wind direction for November 2012. |
 |
|
Figure 4.
Soil & Sea surface
temperature for November 2012. |
 |
|
Figure 5.
Mean wind speed, calm hours and air pressure for November 2012. |
|