|
|
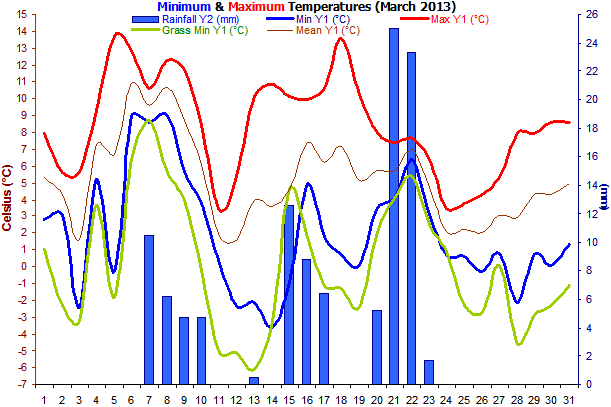
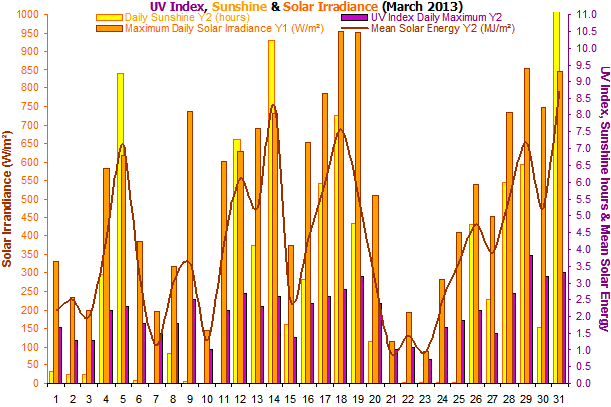
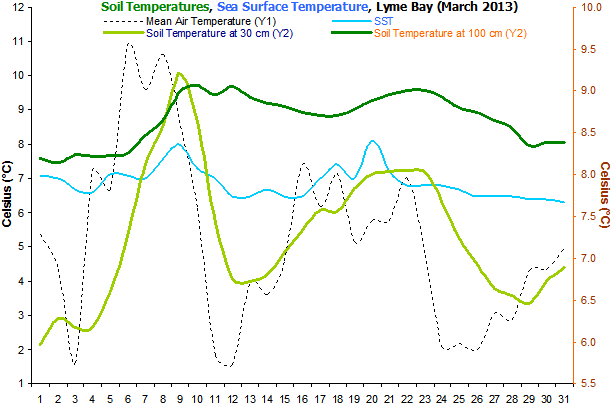
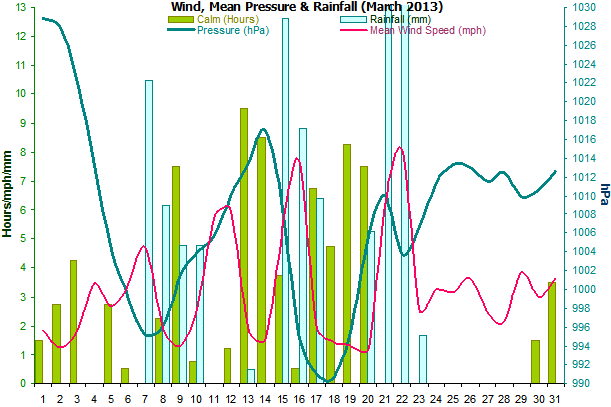
Weather Data for Otter Valley, Devon. March 2013 |
|
|
Temp oC |
Grass |
Hum (%) |
Soil oC |
DP (oC) |
Wind (mph) |
Rain |
Air (hPa) |
W/m² |
UV |
Sun |
Frost |
Calm |
Wind |
Sea |
Observations |
|
|
Min |
Max |
Min |
Min |
Max |
30 |
100 |
Min |
Max |
Max |
Ave |
Run |
mm |
Min |
Max |
Max |
Max |
Hours |
Hours |
Hours |
Chill |
Temp |
|
1 |
2.8 |
7.9 |
1.0 |
65 |
90 |
6.0 |
8.2 |
0.0 |
4.6 |
16 |
1.9 |
44 |
0.0 |
1028 |
1030 |
331 |
1.7 |
0.4 |
0.0 |
1.5 |
1.8 |
7.1 |
Brief sunny intervals all day |
|
2 |
3.1 |
5.6 |
-2.3 |
70 |
90 |
6.3 |
8.2 |
-2.2 |
0.8 |
11 |
1.3 |
31 |
0.0 |
1026 |
1030 |
233 |
1.3 |
0.3 |
0.0 |
2.8 |
-0.8 |
7.0 |
Brief sunny intervals all day |
|
3 |
-2.4 |
5.6 |
-3.2 |
78 |
96 |
6.2 |
8.2 |
-3.5 |
2.4 |
15 |
1.9 |
45 |
0.0 |
1018 |
1026 |
199 |
1.3 |
0.3 |
9.8 |
4.3 |
-3.5 |
6.7 |
Brief sunny intervals all day |
|
4 |
5.2 |
9.3 |
3.7 |
75 |
89 |
6.2 |
8.2 |
2.4 |
5.0 |
23 |
3.5 |
83 |
0.0 |
1008 |
1019 |
583 |
2.2 |
3.3 |
0.0 |
0.0 |
2.5 |
6.6 |
Sunny intervals all day |
|
5 |
-0.3 |
13.7 |
-1.8 |
66 |
99 |
6.6 |
8.2 |
-1.0 |
8.1 |
14 |
2.7 |
64 |
0.0 |
1001 |
1008 |
617 |
2.3 |
9.2 |
2.0 |
2.8 |
-1.8 |
7.1 |
Sunny intervals all day |
|
6 |
8.9 |
12.9 |
6.4 |
74 |
87 |
7.3 |
8.3 |
5.2 |
8.7 |
14 |
3.5 |
83 |
0.0 |
997 |
1001 |
385 |
1.8 |
0.1 |
0.0 |
0.5 |
8.3 |
7.1 |
Brief sunny intervals all day |
|
7 |
8.6 |
10.6 |
8.7 |
82 |
98 |
8.1 |
8.5 |
7.5 |
9.4 |
16 |
4.7 |
113 |
10.5 |
993 |
998 |
197 |
1.5 |
0.0 |
0.0 |
0.0 |
7.1 |
7.0 |
Cloudy all day |
|
8 |
9.0 |
12.3 |
5.6 |
91 |
99 |
8.6 |
8.7 |
6.9 |
11.2 |
10 |
1.9 |
45 |
6.2 |
993 |
1000 |
316 |
1.8 |
0.9 |
0.0 |
2.3 |
7.4 |
7.6 |
Brief sunny intervals all day |
|
9 |
5.7 |
11.7 |
4.0 |
92 |
99 |
9.2 |
9.0 |
5.2 |
10.6 |
13 |
1.3 |
32 |
4.8 |
999 |
1003 |
736 |
2.5 |
0.1 |
0.0 |
7.5 |
5.5 |
8.0 |
Brief sunny intervals all day |
|
10 |
3.8 |
8.4 |
-0.2 |
87 |
97 |
8.6 |
9.1 |
0.5 |
8.0 |
18 |
2.5 |
60 |
4.8 |
1003 |
1005 |
145 |
1.0 |
0.0 |
0.0 |
0.8 |
-0.7 |
7.3 |
Cloudy all day |
|
11 |
0.2 |
3.4 |
-5.1 |
61 |
91 |
7.4 |
9.0 |
-6.6 |
0.5 |
28 |
5.7 |
137 |
0.0 |
1004 |
1008 |
602 |
2.2 |
0.0 |
0.0 |
0.0 |
-5.1 |
7.0 |
Cloudy all day |
|
12 |
-2.3 |
5.4 |
-5.1 |
51 |
85 |
6.8 |
9.0 |
-6.3 |
-1.5 |
26 |
6.0 |
144 |
0.0 |
1008 |
1012 |
629 |
2.7 |
7.3 |
12.0 |
1.3 |
-6.6 |
6.5 |
Sunny intervals all day |
|
13 |
-2.1 |
10.1 |
-6.1 |
55 |
92 |
6.7 |
8.9 |
-3.6 |
4.3 |
17 |
1.9 |
46 |
0.5 |
1012 |
1015 |
691 |
2.3 |
4.1 |
5.0 |
9.5 |
-2.3 |
6.5 |
Sunny intervals all day |
|
14 |
-3.6 |
10.8 |
-3.2 |
41 |
97 |
6.8 |
8.9 |
-4.7 |
1.4 |
17 |
1.5 |
37 |
0.0 |
1015 |
1019 |
732 |
2.6 |
10.2 |
11.0 |
8.5 |
-4.0 |
6.7 |
Sunny all day |
|
15 |
-0.9 |
10.1 |
4.6 |
76 |
97 |
7.1 |
8.8 |
-2.1 |
7.1 |
27 |
5.4 |
130 |
12.6 |
1001 |
1016 |
375 |
1.4 |
1.8 |
3.3 |
3.8 |
-1.1 |
6.5 |
Sunny intervals am, rain pm |
|
16 |
4.9 |
9.9 |
1.7 |
78 |
96 |
7.3 |
8.7 |
3.3 |
7.2 |
30 |
7.7 |
185 |
8.8 |
989 |
1001 |
653 |
2.4 |
3.1 |
0.0 |
0.5 |
2.2 |
6.5 |
Showers all day |
|
17 |
1.8 |
10.6 |
-1.1 |
59 |
98 |
7.6 |
8.7 |
1.2 |
5.0 |
13 |
2.0 |
49 |
6.4 |
989 |
994 |
786 |
2.6 |
6.0 |
0.0 |
6.8 |
1.3 |
7.0 |
Showers am, sunny intervals pm |
|
18 |
0.7 |
13.6 |
-1.3 |
46 |
97 |
7.6 |
8.7 |
-0.6 |
5.6 |
11 |
1.4 |
35 |
0.0 |
988 |
993 |
953 |
2.8 |
8.0 |
0.0 |
4.8 |
0.0 |
7.4 |
Sunny intervals all day |
|
19 |
0.1 |
10.2 |
-2.4 |
77 |
96 |
7.8 |
8.8 |
-1.2 |
6.8 |
10 |
1.3 |
32 |
0.0 |
993 |
998 |
952 |
3.2 |
4.8 |
0.0 |
8.3 |
-0.3 |
7.0 |
Sunny intervals all day |
|
20 |
3.5 |
8.0 |
2.0 |
82 |
97 |
8.0 |
8.9 |
2.9 |
6.3 |
12 |
1.2 |
31 |
5.2 |
998 |
1014 |
511 |
2.4 |
1.3 |
0.0 |
7.5 |
3.3 |
8.1 |
Brief sunny intervals all day |
|
21 |
4.1 |
7.4 |
4.1 |
88 |
98 |
8.0 |
9.0 |
3.9 |
6.9 |
30 |
6.3 |
150 |
25.0 |
1006 |
1014 |
116 |
1.0 |
0.0 |
0.0 |
0.0 |
2.2 |
7.2 |
Rain all day |
|
22 |
6.4 |
7.6 |
5.4 |
90 |
98 |
8.1 |
9.0 |
5.1 |
7.3 |
32 |
8.1 |
194 |
23.3 |
1001 |
1007 |
194 |
1.1 |
0.0 |
0.0 |
0.0 |
3.0 |
6.8 |
Rain, intermittent all day |
|
23 |
3.1 |
6.4 |
2.5 |
92 |
96 |
8.0 |
9.0 |
1.2 |
5.4 |
22 |
2.6 |
62 |
1.7 |
1003 |
1010 |
86 |
0.7 |
0.0 |
0.0 |
0.0 |
1.6 |
6.8 |
Cloudy all day |
|
24 |
0.7 |
3.5 |
0.9 |
84 |
93 |
7.7 |
8.9 |
-1.3 |
1.4 |
15 |
3.3 |
72 |
0.0 |
1009 |
1013 |
281 |
1.7 |
0.0 |
0.0 |
0.0 |
-1.2 |
6.8 |
Cloudy all day |
|
25 |
0.6 |
3.8 |
-2.3 |
71 |
87 |
7.2 |
8.8 |
-2.9 |
-0.6 |
19 |
3.1 |
75 |
0.0 |
1013 |
1014 |
408 |
1.9 |
0.0 |
0.0 |
0.0 |
-1.0 |
6.7 |
Cloudy all day |
|
26 |
-0.3 |
4.3 |
-2.7 |
68 |
84 |
6.9 |
8.7 |
-3.0 |
-0.6 |
20 |
3.6 |
87 |
0.0 |
1012 |
1014 |
541 |
2.2 |
4.7 |
4.0 |
0.0 |
-3.2 |
6.5 |
Sunny intervals am, cloudy pm |
|
27 |
0.8 |
5.3 |
0.1 |
60 |
84 |
6.6 |
8.6 |
-3.2 |
-0.4 |
12 |
2.4 |
58 |
0.0 |
1011 |
1013 |
451 |
1.5 |
2.5 |
0.0 |
0.0 |
-0.6 |
6.5 |
Sunny intervals am, cloudy pm |
|
28 |
-2.1 |
7.9 |
-4.5 |
54 |
89 |
6.6 |
8.5 |
-3.9 |
1.2 |
13 |
2.2 |
52 |
0.0 |
1012 |
1013 |
733 |
2.7 |
6.0 |
4.0 |
0.0 |
-3.4 |
6.5 |
Sunny intervals am, cloudy pm |
|
29 |
0.7 |
7.9 |
-2.9 |
52 |
75 |
6.5 |
8.4 |
-4.2 |
-0.6 |
22 |
3.8 |
92 |
0.0 |
1007 |
1013 |
851 |
3.8 |
6.5 |
0.0 |
0.0 |
-1.0 |
6.4 |
Sunny intervals all day |
|
30 |
0.1 |
8.6 |
-2.3 |
50 |
82 |
6.7 |
8.4 |
-4.4 |
-0.5 |
18 |
3.0 |
72 |
0.0 |
1007 |
1014 |
748 |
3.2 |
1.7 |
0.0 |
1.5 |
-1.8 |
6.4 |
Sunny intervals all day |
|
31 |
1.3 |
8.6 |
-1.1 |
55 |
83 |
6.9 |
8.4 |
-2.8 |
1.1 |
19 |
3.6 |
85 |
0.0 |
1011 |
1015 |
844 |
3.3 |
11.8 |
0.0 |
3.5 |
-0.7 |
6.3 |
Sunny intervals all day |
|
|
2.0 |
8.4 |
0.1 |
70 |
92 |
7 |
8.7 |
-0.4 |
4.3 |
18 |
3.3 |
2421 |
110 |
1005 |
1010 |
512 |
2.1 |
94 |
51 |
75 |
0.2 |
6.9 |
|