|
January 2020 |
 |
|
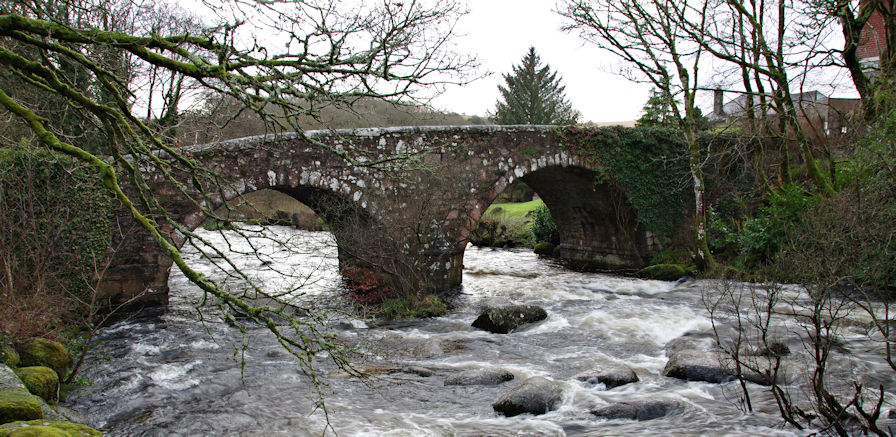
An old bridge over a Dartmoor
river on a mild January day |
|
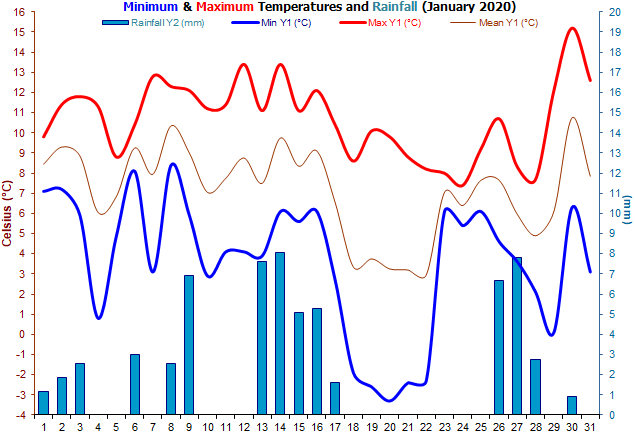
Overall, warmer than normal
with sunshine and rainfall being a little below average. A month
where a couple of slightly more unusual station records were broken;
highest number of sunless days and the highest air pressure. A gust
of 67 mph was the 2nd highest recorded and a maximum temperature of
15.2°C was the 3rd warmest January day. Records start 2005. Warmest
January since 2012 (7.4°C); driest since 2019 (48.2 mm) and the
cloudiest since 2019 (67.0 hours). |
|
Summary for January 2020 |
|
Mean Max: |
10.7ºC |
(+1.8ºC) |
|
Mean Min: |
3.6ºC |
(+0.5ºC) |
|
Mean: |
7.0ºC |
|
|
High Max: |
15.2ºC |
30th |
|
Low Max: |
7.4ºC |
24th |
|
High Min: |
8.4ºC |
8th |
|
Low Min: |
-3.3ºC |
20th |
|
Mean Grass Min: |
0.8ºC |
|
|
Grass Min: |
-5.6ºC |
20th |
|
Days >10°C |
20 Days |
|
|
Days >5°C |
31 Days |
|
|
Nights >5°C |
13 Days |
|
|
Nights >0°C |
26 Days |
|
|
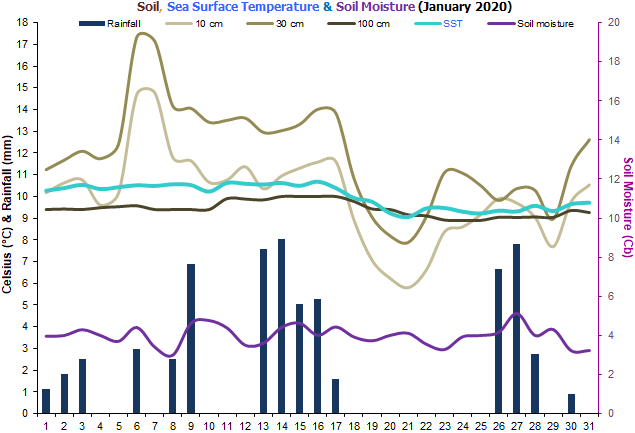
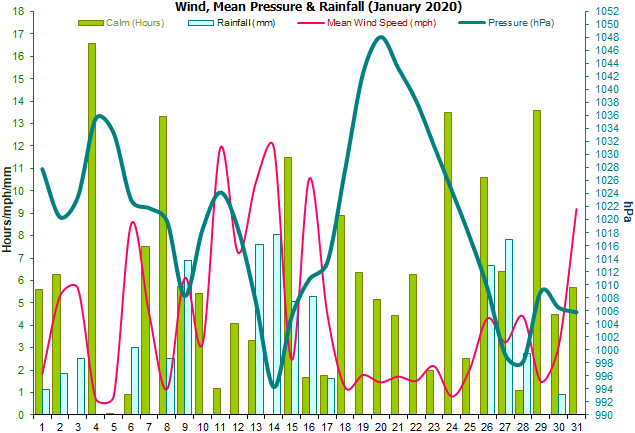
Rain Total (gauge): |
65.4 mm |
(80%) |
|
Rain Total (tipping bucket): |
63.7 mm |
(78%) |
|
Rain Days >0.2 mm: |
15 Days |
|
|
Rain Days >1.0 mm: |
14 Days |
|
|
Max 24 hrs: |
8.1 mm |
14th |
|
Days without any rain: |
16 |
|
|
Air Frost: |
5 Days |
|
|
Grass Frost: |
10 Days |
|
|
Snow Falling: |
0 Days |
|
|
Snow (50%) @ 9am: |
0 Days |
|
|
Ice Days: |
0 Days |
|
|
Thunder Heard: |
0 Days |
|
|
Hail <5 mm: |
2 Days |
|
|
Hail >5 mm: |
0 Days |
|
|
Fog @ 9am: |
1 Day |
|
|
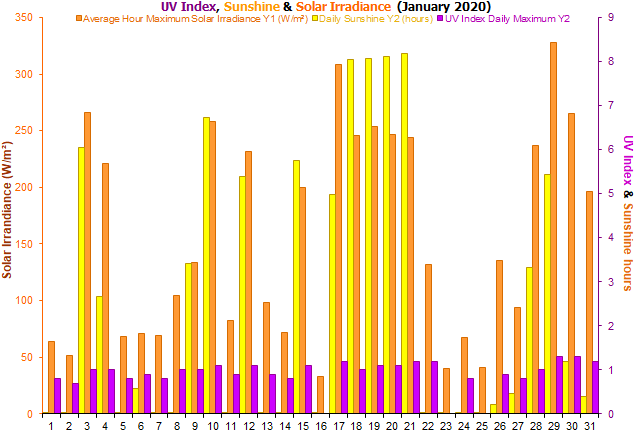
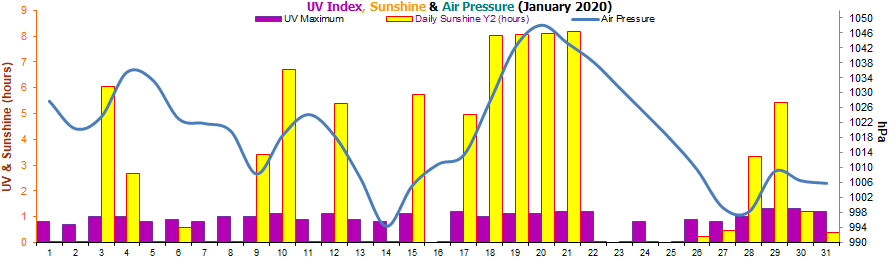
Total Monthly Sunshine: |
79.2 Hours |
(97%) |
|
Most Sunshine in a Day: |
8.2 Hours |
21st |
|
Average Daily Sunshine: |
2.6 Hours |
|
|
Sunless Days: |
13 Days |
|
|
Cloudless Days: |
4 Days |
|
|
Total Possible Sunshine: |
264.6 Hours |
|
|
Percentage of Total Sun: |
30% |
|
|
Average Sunny Interval: |
18.1 |
mins |
|
Maximum UV Index: |
1.3 |
29th |
|
Mean Soil Temp @ 10 cm: |
10.0ºC |
|
|
Min Soil Temp @ 10 cm: |
5.8ºC |
21st |
|
Max Soil Temp @ 10 cm: |
14.8ºC |
7th |
|
Mean Soil Temp @ 30 cm: |
12.0ºC |
|
|
Min Soil Temp @ 30 cm: |
7.9ºC |
21st |
|
Max Soil Temp @ 30 cm: |
17.3ºC |
6th |
|
Mean Soil Temp @ 100 cm: |
9.4ºC |
|
|
Min Soil Temp @ 100 cm: |
8.9ºC |
24th |
|
Max Soil Temp @ 100 cm: |
10.0ºC |
14th |
|
Ave 10 Min Wind >39 mph: |
0.00 Days |
|
|
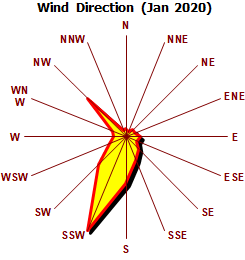
N: |
0.92 Days |
3% |
|
NE: |
1.13 Days |
4% |
|
E: |
1.55 Days |
5% |
|
SE: |
2.26 Days |
7% |
|
S: |
6.88 Days |
22% |
|
SW: |
6.15 Days |
20% |
|
W: |
1.74 Days |
6% |
|
NW: |
4.13 Days |
13% |
|
Calm: |
6.23 Days |
20% |
|
Wind Chill Low: |
-5.9ºC |
20th |
|
Mean Wind: |
4.4 mph |
|
|
Max Gust: |
67 mph |
14th |
|
Mean Cloud Cover: |
62% |
|
|
Mean RH @ 9am: |
96% |
|
|
Rain >0.1mm/hour: |
19.5 Hours |
|
|
Frost Duration: |
60.8 Hours |
|
|
Air Frost in a Day: |
15.2 Hours |
19th |
|
Mean Sea Temperature: |
10.0ºC |
(+1.0ºC) |
|
Normal for Month: |
9.0ºC |
|
|
Max Sea Temperature: |
10.9ºC |
3rd |
|
Min Sea Temperature: |
8.0ºC |
21st |
|
Mean Pressure @ 9am: |
1020.3 hPa |
|
|
Mean Pressure: |
1019.6 hPa |
|
|
Max Pressure: |
1050.1 hPa |
20th |
|
Min Pressure: |
990.7 hPa |
14th |
|
Max Change in 24 hours: |
25.9 hPa |
13th |
|
Radiation Daily Mean: |
2.73 MJ/m² |
|
|
Max Daily Value: |
5.20 MJ/m² |
29th |
|
Min Daily Value: |
0.95 MJ/m² |
16th |
|
Number of Days with Data: |
31 Days |
|
|
1-Hour Maximum: |
328 W/m² |
29th |
|
Starting Time of the Hour: |
|
13:00 |
|
Max Dewpoint: |
14.1ºC |
30th |
|
Min Dewpoint: |
-3.8ºC |
20th |
|
Mean Dewpoint: |
6.1ºC |
|
|
Max Humidity: |
99% |
1st |
|
Min Humidity: |
68% |
20th |
|
Mean Humidity: |
92% |
|
 |
|
|
|
Weather Data for Otter Valley, Devon.
January 2020 |
|
|
Temp oC |
Grass |
Hum (%) |
Soil oC
(cm) |
Soil |
DP (oC) |
Wind (mph) |
Rain |
Air (hPa) |
W/m² |
UV |
Sun |
Frost |
Sea |
Observations |
|
|
Min |
Max |
Min |
Min |
Max |
10 |
30 |
100 |
(cb) |
Min |
Max |
Max |
Ave |
Run |
mm |
Min |
Max |
Max |
Max |
Hours |
Hours |
Temp |
|
1 |
7.1 |
9.8 |
2.8 |
90 |
99 |
10.2 |
11.2 |
9.4 |
4.0 |
5.5 |
9.6 |
11 |
1.8 |
44 |
1.2 |
1026 |
1029 |
81 |
0.8 |
0.0 |
0.0 |
10.3 |
Cloudy all day |
|
2 |
7.2 |
11.4 |
3.3 |
90 |
99 |
10.6 |
11.7 |
9.4 |
4.0 |
6.6 |
11.0 |
25 |
5.3 |
128 |
1.8 |
1014 |
1026 |
63 |
0.7 |
0.0 |
0.0 |
10.4 |
Cloudy all day |
|
3 |
5.9 |
11.8 |
-1.7 |
75 |
98 |
10.8 |
12.1 |
9.4 |
4.3 |
1.2 |
11.5 |
28 |
5.6 |
135 |
2.5 |
1013 |
1034 |
262 |
1.0 |
6.1 |
0.0 |
10.5 |
Sunny intervals all day |
|
4 |
0.8 |
11.3 |
-1.7 |
83 |
99 |
9.6 |
11.7 |
9.5 |
4.0 |
0.2 |
8.9 |
18 |
0.7 |
17 |
0.0 |
1034 |
1037 |
269 |
1.0 |
2.7 |
0.0 |
10.3 |
Sunny intervals all day |
|
5 |
4.9 |
8.8 |
1.7 |
89 |
99 |
10.2 |
12.4 |
9.5 |
3.7 |
4.4 |
8.0 |
10 |
0.8 |
20 |
0.0 |
1030 |
1037 |
74 |
0.8 |
0.0 |
0.0 |
10.4 |
Cloudy all day |
|
6 |
8.1 |
10.4 |
7.2 |
86 |
98 |
14.7 |
17.3 |
9.6 |
4.4 |
5.9 |
10.1 |
32 |
8.5 |
205 |
3.0 |
1016 |
1030 |
130 |
0.9 |
0.6 |
0.0 |
10.5 |
Showers midday, sunny ints pm |
|
7 |
3.1 |
12.8 |
8.3 |
94 |
99 |
14.8 |
17.1 |
9.4 |
3.4 |
2.4 |
12.4 |
22 |
4.5 |
109 |
0.0 |
1019 |
1025 |
83 |
0.8 |
0.0 |
0.0 |
10.5 |
Cloudy all day |
|
8 |
8.4 |
12.3 |
5.6 |
91 |
99 |
11.8 |
14.2 |
9.4 |
3.0 |
7.8 |
11.8 |
13 |
1.2 |
28 |
2.5 |
1016 |
1024 |
125 |
1.0 |
0.0 |
0.0 |
10.6 |
Cloudy all day |
|
9 |
5.9 |
12.1 |
2.8 |
92 |
99 |
11.6 |
14.1 |
9.4 |
4.6 |
5.0 |
12.0 |
31 |
6.1 |
147 |
6.9 |
1001 |
1015 |
183 |
1.0 |
3.4 |
0.0 |
10.5 |
Sunshine & showers |
|
10 |
2.9 |
11.2 |
0.6 |
70 |
98 |
10.7 |
13.4 |
9.4 |
4.8 |
2.1 |
7.2 |
23 |
3.2 |
77 |
0.0 |
1008 |
1029 |
282 |
1.1 |
6.7 |
0.0 |
10.2 |
Sunny intervals all day |
|
11 |
4.1 |
11.4 |
2.8 |
88 |
98 |
10.8 |
13.5 |
9.9 |
4.4 |
3.7 |
9.9 |
41 |
11.9 |
286 |
0.0 |
1019 |
1029 |
97 |
0.9 |
0.0 |
0.0 |
10.6 |
Cloudy all day |
|
12 |
4.1 |
13.4 |
0.0 |
70 |
98 |
11.4 |
13.6 |
9.9 |
3.5 |
3.0 |
10.4 |
28 |
7.2 |
173 |
0.0 |
1016 |
1021 |
317 |
1.1 |
5.4 |
0.0 |
10.6 |
Sunny intervals all day |
|
13 |
3.9 |
11.1 |
0.0 |
92 |
99 |
10.4 |
13.0 |
9.8 |
3.6 |
3.2 |
10.7 |
60 |
10.4 |
250 |
7.6 |
994 |
1020 |
148 |
0.9 |
0.0 |
0.0 |
10.6 |
Cloudy all day |
|
14 |
6.1 |
13.4 |
1.7 |
90 |
99 |
10.9 |
13.0 |
10.0 |
4.4 |
5.0 |
13.0 |
67 |
11.9 |
287 |
8.1 |
991 |
998 |
70 |
0.8 |
0.0 |
0.0 |
10.6 |
Cloudy all day |
|
15 |
5.6 |
11.1 |
0.6 |
73 |
99 |
11.3 |
13.3 |
10.0 |
4.6 |
4.0 |
10.7 |
24 |
2.5 |
59 |
5.1 |
994 |
1016 |
201 |
1.1 |
5.7 |
0.0 |
10.5 |
Cloudy early am then sunny |
|
16 |
6.1 |
12.1 |
0.6 |
91 |
98 |
11.6 |
14.0 |
10.0 |
4.0 |
5.2 |
11.7 |
43 |
10.6 |
253 |
5.3 |
1005 |
1017 |
46 |
0.0 |
0.0 |
0.0 |
10.7 |
Rain all day |
|
17 |
2.7 |
10.4 |
-0.6 |
78 |
97 |
11.6 |
13.8 |
10.0 |
4.4 |
1.6 |
9.9 |
25 |
4.5 |
108 |
1.6 |
1007 |
1020 |
375 |
1.2 |
5.0 |
0.0 |
10.4 |
Sunshine & showers |
|
18 |
-1.9 |
8.6 |
-4.4 |
80 |
99 |
8.9 |
10.8 |
9.8 |
3.9 |
-2.3 |
6.5 |
9 |
1.2 |
30 |
0.0 |
1020 |
1035 |
272 |
1.0 |
8.0 |
8.0 |
9.9 |
Sunny all day |
|
19 |
-2.6 |
10.1 |
-5.0 |
74 |
99 |
7.1 |
9.0 |
9.4 |
3.7 |
-3.0 |
6.2 |
8 |
1.8 |
43 |
0.0 |
1036 |
1049 |
259 |
1.1 |
8.1 |
15.2 |
9.8 |
Sunny all day |
|
20 |
-3.3 |
9.8 |
-5.6 |
68 |
98 |
6.2 |
8.2 |
9.4 |
4.0 |
-3.8 |
4.6 |
8 |
1.5 |
35 |
0.0 |
1046 |
1050 |
249 |
1.1 |
8.1 |
15.0 |
9.2 |
Sunny all day |
|
21 |
-2.4 |
8.8 |
-5.0 |
82 |
99 |
5.8 |
7.9 |
9.2 |
4.1 |
-2.9 |
6.3 |
7 |
1.7 |
41 |
0.0 |
1040 |
1046 |
250 |
1.2 |
8.2 |
14.7 |
9.1 |
Sunny all day |
|
22 |
-2.3 |
8.2 |
-4.4 |
95 |
99 |
6.6 |
9.1 |
9.1 |
3.6 |
-2.9 |
7.6 |
12 |
1.5 |
36 |
0.0 |
1036 |
1041 |
132 |
1.2 |
0.0 |
8.0 |
9.5 |
Dull all day |
|
23 |
6.1 |
8.0 |
6.1 |
93 |
96 |
8.4 |
11.1 |
8.9 |
3.3 |
4.8 |
7.4 |
13 |
2.2 |
52 |
0.0 |
1027 |
1036 |
42 |
0.0 |
0.0 |
0.0 |
9.5 |
Dull all day |
|
24 |
5.4 |
7.4 |
5.0 |
92 |
98 |
8.6 |
11.1 |
8.9 |
3.9 |
4.8 |
6.4 |
8 |
0.8 |
20 |
0.0 |
1022 |
1027 |
96 |
0.8 |
0.0 |
0.0 |
9.3 |
Dull all day |
|
25 |
6.1 |
9.2 |
6.1 |
91 |
98 |
9.2 |
10.5 |
8.9 |
4.0 |
5.3 |
8.9 |
15 |
2.0 |
49 |
0.0 |
1013 |
1022 |
50 |
0.0 |
0.0 |
0.0 |
9.2 |
Dull all day |
|
26 |
4.6 |
10.7 |
0.0 |
94 |
99 |
9.9 |
9.8 |
9.0 |
4.2 |
4.0 |
10.4 |
28 |
4.3 |
104 |
6.7 |
1006 |
1013 |
173 |
0.9 |
0.2 |
0.0 |
9.4 |
Rain am, brief sunny ints pm |
|
27 |
3.6 |
8.3 |
0.0 |
94 |
99 |
9.7 |
10.4 |
9.0 |
5.1 |
2.9 |
7.8 |
22 |
3.2 |
78 |
7.8 |
993 |
1006 |
123 |
0.8 |
0.5 |
0.0 |
9.3 |
Sunshine & showers |
|
28 |
2.1 |
7.7 |
-1.1 |
82 |
98 |
9.0 |
10.3 |
9.1 |
4.0 |
0.9 |
5.7 |
34 |
4.4 |
106 |
2.8 |
991 |
1005 |
362 |
1.0 |
3.3 |
0.0 |
9.6 |
Sunny intervals all day |
|
29 |
0.1 |
12.1 |
-3.3 |
74 |
99 |
7.7 |
9.0 |
9.0 |
4.3 |
-0.5 |
8.5 |
17 |
1.5 |
37 |
0.0 |
1005 |
1013 |
354 |
1.3 |
5.4 |
0.0 |
9.3 |
Sunny intervals all day |
|
30 |
6.3 |
15.2 |
1.7 |
91 |
99 |
9.8 |
11.4 |
9.4 |
3.2 |
2.6 |
14.1 |
25 |
3.1 |
112 |
0.9 |
1002 |
1011 |
387 |
1.3 |
1.2 |
0.0 |
9.6 |
Brief sunny intervals |
|
31 |
3.1 |
12.6 |
0.0 |
95 |
97 |
10.5 |
12.6 |
9.3 |
3.2 |
10.6 |
12.1 |
27 |
9.2 |
97 |
0.0 |
1003 |
1008 |
245 |
1.2 |
0.4 |
0.0 |
9.7 |
Brief sunny intervals |
|
|
3.6 |
10.7 |
0.8 |
85 |
98 |
10.0 |
12.0 |
9.4 |
4.0 |
2.8 |
9.4 |
24 |
4.4 |
3165 |
63.7 |
1014 |
1025 |
187 |
0.9 |
79.2 |
60.8 |
10.0 |
|
 |
|
|
UV Light
|
Month So Far
|
Year So Far
|
Recording Data
|
Time-Lapse Videos
|
World
Weather |
Met Office 5-Day
|
Humidity Calculation
|
Links |